01. The Problem
Production incidents are expensive. According to Gartner, the average cost of IT downtime is $5,600 per minute. A major cloud provider outage can cost millions per hour. Yet the median time to diagnose the root cause of an incident is 4-6 hours — most of that spent searching through logs, correlating events, and ruling out false leads.
Logs are overwhelming. A typical microservices application generates gigabytes of logs per day across dozens of services. When an incident occurs, engineers must search through logs from the affected service, its dependencies, the infrastructure layer, and the network layer. The signal-to-noise ratio is terrible — thousands of log lines are normal, and the root cause might be a single log entry buried among them.
Root cause analysis is hypothesis-driven. Experienced engineers follow a mental process: "The API is returning 500s. Is it the database? Let me check DB connection pool metrics. No, the pool is fine. Is it a downstream service? Let me check the auth service. Yes, auth service started returning timeouts 5 minutes before the API errors. What caused the auth service to fail? Let me check its deployment history — there was a deploy at 14:32, and errors started at 14:35."
Data sources for this design: We use the Loghub open-source log dataset collection, which contains real-world logs from Apache, HDFS, OpenStack, and other systems. These logs exhibit the same patterns as production logs: mixed formats, varying verbosity levels, and errors interleaved with normal operation.
02. Why an Agent
Why not log aggregation tools? Tools like Splunk, Datadog, and Elastic can search and filter logs, but they require the engineer to know what to search for. The agent can formulate search queries based on the incident symptoms and refine them based on what it finds — mimicking the iterative search process of an experienced SRE.
Why not rule-based alerting? Rules catch known failure modes ("alert if error rate exceeds 1%"). But novel failures — race conditions, cascading timeouts, configuration drift — do not match existing rules. The agent can reason about unfamiliar patterns using the LLM's general knowledge of distributed systems.
Why an agent? Root cause analysis is fundamentally hypothesis-driven and iterative:
- Parse and filter — Extract structured events from raw log text, filtering by time window and severity to reduce noise.
- Correlate — Find temporal correlations across services: did errors in Service A start shortly after errors in Service B?
- Form hypothesis — Based on correlations, the LLM hypothesizes a root cause: "Service B's timeout is causing Service A's 500 errors because A depends on B."
- Test hypothesis — The agent checks the dependency graph, examines Service B's logs for the specific time window, and looks for corroborating evidence.
- Refine or reject — If the evidence supports the hypothesis, the agent digs deeper. If not, it forms a new hypothesis and tests again.
- Generate timeline — Once the root cause is identified, the agent constructs a timeline of events from initial trigger to user impact.
Architecture Diagram
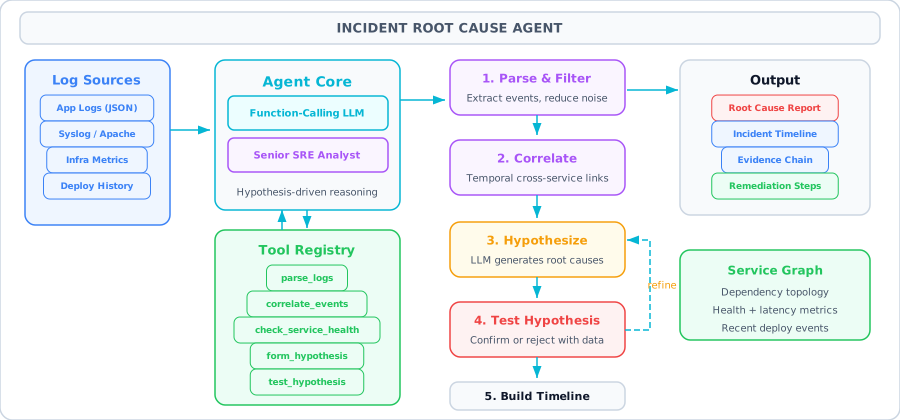
03. Architecture
Log Parser
Parses structured (JSON) and unstructured (syslog, Apache) log formats. Extracts timestamp, severity, service name, message, and any structured fields (request ID, user ID, error code). Handles multiple log formats simultaneously.
Event Correlator
Finds temporal correlations between events across services. Uses a time window (e.g., events within 5 minutes of each other) to identify potential causal chains. Returns pairs of correlated events with lag times.
Service Status Checker
Queries the service dependency graph and checks health metrics for a specific service: error rate, latency percentiles, CPU/memory usage, recent deployments, and configuration changes.
Hypothesis Former
Uses the LLM to generate ranked hypotheses about the root cause based on observed symptoms. Each hypothesis includes the suspected cause, expected evidence, and a test to confirm or refute it.
Hypothesis Tester
Tests a specific hypothesis by querying logs and metrics for the predicted evidence. Returns a confidence score (0-1) and the supporting/contradicting evidence found.
Timeline Generator
Constructs a chronological timeline of events from the initial trigger through cascading failures to user impact. Includes timestamps, affected services, and the causal chain.
04. Tools & APIs
Tool definitions for the incident investigation agent. The tools operate on a simulated log store that mimics what you would see in a real observability platform.
import json, re
from datetime import datetime, timedelta
from collections import Counter
from openai import OpenAI

client = OpenAI()

# ── Tool Definitions ──
tools = [
    {
        "type": "function",
        "function": {
            "name": "parse_logs",
            "description": "Parse and filter logs from a specific service within a time window. Returns structured log entries with timestamps, levels, and messages.",
            "parameters": {
                "type": "object",
                "properties": {
                    "service": {"type": "string", "description": "Service name, e.g. 'api-gateway', 'auth-service', 'database'"},
                    "start_time": {"type": "string", "description": "ISO format start time"},
                    "end_time": {"type": "string", "description": "ISO format end time"},
                    "level": {"type": "string", "enum": ["ERROR", "WARN", "INFO", "DEBUG", "ALL"]}
                },
                "required": ["service"]
            }
        }
    },
    {
        "type": "function",
        "function": {
            "name": "correlate_events",
            "description": "Find temporal correlations between error events across two or more services within a time window.",
            "parameters": {
                "type": "object",
                "properties": {
                    "services": {"type": "array", "items": {"type": "string"}, "description": "List of services to correlate"},
                    "window_minutes": {"type": "integer", "description": "Correlation window in minutes (default 5)"}
                },
                "required": ["services"]
            }
        }
    },
    {
        "type": "function",
        "function": {
            "name": "check_service_status",
            "description": "Check health metrics, recent deployments, and config changes for a service.",
            "parameters": {
                "type": "object",
                "properties": {
                    "service": {"type": "string"},
                    "check_type": {
                        "type": "string",
                        "enum": ["health", "deployments", "config_changes", "dependencies"]
                    }
                },
                "required": ["service", "check_type"]
            }
        }
    },
    {
        "type": "function",
        "function": {
            "name": "form_hypothesis",
            "description": "Generate ranked root cause hypotheses based on observed symptoms and correlations.",
            "parameters": {
                "type": "object",
                "properties": {
                    "symptoms": {"type": "array", "items": {"type": "string"}, "description": "List of observed symptoms"},
                    "correlations": {"type": "array", "items": {"type": "object"}, "description": "Event correlations found so far"}
                },
                "required": ["symptoms"]
            }
        }
    },
    {
        "type": "function",
        "function": {
            "name": "test_hypothesis",
            "description": "Test a root cause hypothesis by searching for predicted evidence in logs and metrics.",
            "parameters": {
                "type": "object",
                "properties": {
                    "hypothesis": {"type": "string", "description": "The hypothesis to test"},
                    "expected_evidence": {"type": "array", "items": {"type": "string"}},
                    "service": {"type": "string"}
                },
                "required": ["hypothesis", "expected_evidence"]
            }
        }
    },
    {
        "type": "function",
        "function": {
            "name": "generate_timeline",
            "description": "Generate a chronological incident timeline from trigger to user impact.",
            "parameters": {
                "type": "object",
                "properties": {
                    "events": {"type": "array", "items": {"type": "object"}},
                    "root_cause": {"type": "string"},
                    "impact": {"type": "string"}
                },
                "required": ["events", "root_cause"]
            }
        }
    }
]
05. The Agent Loop
The root cause agent follows a hypothesis-driven investigation loop — the same mental model used by experienced SREs, but automated and systematic.
- Parse Incident Logs — The agent receives the initial symptoms (e.g., "API returning 500s starting at 14:35") and parses logs from the affected service.
- Identify Error Patterns — The agent counts error types, identifies the most frequent error messages, and notes the error rate timeline.
- Check Dependencies — The agent queries the service dependency graph and checks the health of upstream/downstream services.
- Correlate Events — The agent looks for temporal correlations: did any other service start erroring around the same time? Was there a deployment or config change?
- Form Hypotheses — Based on correlations, the agent generates ranked hypotheses: "H1: Auth service deploy at 14:32 introduced a bug (confidence: 0.7). H2: Database connection pool exhaustion (confidence: 0.3)."
- Test Top Hypothesis — The agent searches for specific evidence predicted by the hypothesis. For H1, it would look for error messages in auth-service logs that match the deploy time.
- Confirm or Reject — If evidence supports H1, the agent deepens the investigation (what changed in the deploy?). If not, it moves to H2.
- Generate Timeline — Once the root cause is confirmed, the agent constructs a full timeline from trigger to resolution.
Why hypothesis-driven? The alternative — searching all logs from all services — is infeasible. A microservices application can have 50+ services each producing thousands of log lines per second. The agent must form hypotheses to focus its search, just as a human engineer would. The key insight is that correlation (events happening close in time) suggests causation worth investigating, not proof of causation.
06. Code Walkthrough
Complete implementation with simulated log data based on Loghub patterns, plus the hypothesis-driven investigation loop.
import json, re
from datetime import datetime, timedelta
from collections import Counter, defaultdict
from openai import OpenAI

client = OpenAI()

# ── Simulated Log Store (based on Loghub patterns) ──
# In production, these would come from Elasticsearch/Splunk/CloudWatch
LOG_STORE = {
    "api-gateway": [
        {"ts": "2025-01-15T14:35:12", "level": "ERROR", "msg": "Upstream timeout: auth-service (30s)"},
        {"ts": "2025-01-15T14:35:14", "level": "ERROR", "msg": "HTTP 500 returned to client, request_id=a1b2c3"},
        {"ts": "2025-01-15T14:35:18", "level": "ERROR", "msg": "Upstream timeout: auth-service (30s)"},
        {"ts": "2025-01-15T14:35:22", "level": "WARN", "msg": "Circuit breaker OPEN for auth-service"},
        {"ts": "2025-01-15T14:30:00", "level": "INFO", "msg": "Health check OK"},
        {"ts": "2025-01-15T14:33:00", "level": "INFO", "msg": "Health check OK"},
    ],
    "auth-service": [
        {"ts": "2025-01-15T14:32:00", "level": "INFO", "msg": "Deployment started: version 2.4.1 -> 2.5.0"},
        {"ts": "2025-01-15T14:33:30", "level": "INFO", "msg": "Deployment complete: version 2.5.0"},
        {"ts": "2025-01-15T14:34:45", "level": "ERROR", "msg": "Redis connection refused: ECONNREFUSED 10.0.1.5:6379"},
        {"ts": "2025-01-15T14:34:46", "level": "ERROR", "msg": "Session cache unavailable, falling back to DB"},
        {"ts": "2025-01-15T14:34:50", "level": "ERROR", "msg": "DB query timeout: SELECT * FROM sessions WHERE token=..."},
        {"ts": "2025-01-15T14:35:10", "level": "ERROR", "msg": "Request processing timeout after 30000ms"},
    ],
    "redis": [
        {"ts": "2025-01-15T14:34:30", "level": "WARN", "msg": "Memory usage 95%, starting eviction"},
        {"ts": "2025-01-15T14:34:40", "level": "ERROR", "msg": "OOM: cannot allocate 64MB for new key"},
        {"ts": "2025-01-15T14:34:42", "level": "ERROR", "msg": "Refusing new connections: maxmemory reached"},
    ],
    "database": [
        {"ts": "2025-01-15T14:34:55", "level": "WARN", "msg": "Connection pool: 48/50 active connections"},
        {"ts": "2025-01-15T14:35:05", "level": "ERROR", "msg": "Connection pool exhausted, 12 requests queued"},
        {"ts": "2025-01-15T14:35:15", "level": "WARN", "msg": "Slow query detected: 8500ms for sessions table scan"},
    ]
}

SERVICE_DEPS = {
    "api-gateway": ["auth-service", "user-service", "product-service"],
    "auth-service": ["redis", "database"],
    "user-service": ["database"],
    "product-service": ["database", "redis"],
}

# ── Tool Implementations ──
def parse_logs(service: str, start_time: str = None,
              end_time: str = None, level: str = "ALL") -> str:
    logs = LOG_STORE.get(service, [])
    if level != "ALL":
        logs = [l for l in logs if l["level"] == level]
    if start_time:
        logs = [l for l in logs if l["ts"] >= start_time]
    if end_time:
        logs = [l for l in logs if l["ts"] <= end_time]
    error_summary = Counter(l["msg"] for l in logs if l["level"] == "ERROR")
    return json.dumps({
        "service": service, "total_entries": len(logs),
        "error_count": sum(1 for l in logs if l["level"] == "ERROR"),
        "entries": logs,
        "error_summary": dict(error_summary)
    }, indent=2)

def correlate_events(services: list, window_minutes: int = 5) -> str:
    all_errors = []
    for svc in services:
        for log in LOG_STORE.get(svc, []):
            if log["level"] == "ERROR":
                all_errors.append({"service": svc, **log})
    all_errors.sort(key=lambda x: x["ts"])
    correlations = []
    for i, e1 in enumerate(all_errors):
        for e2 in all_errors[i+1:]:
            if e1["service"] != e2["service"]:
                t1 = datetime.fromisoformat(e1["ts"])
                t2 = datetime.fromisoformat(e2["ts"])
                lag = (t2 - t1).total_seconds()
                if 0 < lag <= window_minutes * 60:
                    correlations.append({
                        "first": {"service": e1["service"], "time": e1["ts"], "msg": e1["msg"]},
                        "second": {"service": e2["service"], "time": e2["ts"], "msg": e2["msg"]},
                        "lag_seconds": lag
                    })
    return json.dumps({"correlations": correlations[:15], "total": len(correlations)})

def check_service_status(service: str, check_type: str) -> str:
    if check_type == "dependencies":
        return json.dumps({"service": service, "depends_on": SERVICE_DEPS.get(service, [])})
    elif check_type == "deployments":
        deploys = {
            "auth-service": [{"version": "2.5.0", "time": "2025-01-15T14:32:00",
                              "changed_files": ["session_handler.py", "redis_config.yaml"]}],
        }
        return json.dumps({"service": service, "recent_deployments": deploys.get(service, [])})
    elif check_type == "config_changes":
        changes = {
            "auth-service": [{"file": "redis_config.yaml",
                              "change": "maxmemory changed from 2gb to 512mb",
                              "time": "2025-01-15T14:32:00"}],
        }
        return json.dumps({"service": service, "config_changes": changes.get(service, [])})
    elif check_type == "health":
        health = {
            "api-gateway": {"status": "degraded", "error_rate": "23%", "p99_latency_ms": 31000},
            "auth-service": {"status": "unhealthy", "error_rate": "67%", "p99_latency_ms": 30500},
            "redis": {"status": "unhealthy", "memory_usage": "100%", "connections_refused": 142},
            "database": {"status": "degraded", "active_connections": "50/50", "queued": 12},
        }
        return json.dumps({"service": service, **health.get(service, {"status": "healthy"})})
    return json.dumps({"error": "Unknown check type"})

def form_hypothesis(symptoms: list, correlations: list = None) -> str:
    prompt = f"""Given these incident symptoms and event correlations, generate
3 ranked root cause hypotheses. For each, specify:
- hypothesis: what you think caused the incident
- confidence: 0.0-1.0
- expected_evidence: what logs/metrics would confirm this
- test_plan: how to verify

Symptoms: {json.dumps(symptoms)}
Correlations: {json.dumps(correlations or [])}"""
    resp = client.chat.completions.create(
        model="gpt-4o",
        messages=[{"role": "user", "content": prompt}],
        response_format={"type": "json_object"}
    )
    return resp.choices[0].message.content

def test_hypothesis(hypothesis: str, expected_evidence: list,
                    service: str = None) -> str:
    evidence_found = []
    evidence_missing = []
    for evidence in expected_evidence:
        found = False
        for svc, logs in LOG_STORE.items():
            if service and svc != service:
                continue
            for log in logs:
                if any(keyword.lower() in log["msg"].lower()
                       for keyword in evidence.split()):
                    evidence_found.append({"expected": evidence,
                                           "found_in": svc, "log": log})
                    found = True
                    break
            if found:
                break
        if not found:
            evidence_missing.append(evidence)
    confidence = len(evidence_found) / max(len(expected_evidence), 1)
    return json.dumps({
        "hypothesis": hypothesis,
        "confidence": round(confidence, 2),
        "evidence_found": evidence_found,
        "evidence_missing": evidence_missing,
        "verdict": "supported" if confidence >= 0.6 else "needs_more_evidence"
    })

def generate_timeline(events: list, root_cause: str, impact: str = "") -> str:
    events.sort(key=lambda x: x.get("time", ""))
    return json.dumps({
        "root_cause": root_cause,
        "impact": impact,
        "timeline": events,
        "duration_minutes": 0 if len(events) < 2 else round(
            (datetime.fromisoformat(events[-1]["time"]) -
             datetime.fromisoformat(events[0]["time"])).total_seconds() / 60, 1)
    }, indent=2)
The agent loop with the investigation system prompt:
# ── Agent Loop ──
TOOL_MAP = {
    "parse_logs": lambda a: parse_logs(a["service"], a.get("start_time"), a.get("end_time"), a.get("level", "ALL")),
    "correlate_events": lambda a: correlate_events(a["services"], a.get("window_minutes", 5)),
    "check_service_status": lambda a: check_service_status(a["service"], a["check_type"]),
    "form_hypothesis": lambda a: form_hypothesis(a["symptoms"], a.get("correlations")),
    "test_hypothesis": lambda a: test_hypothesis(a["hypothesis"], a["expected_evidence"], a.get("service")),
    "generate_timeline": lambda a: generate_timeline(a["events"], a["root_cause"], a.get("impact", "")),
}

SYSTEM_PROMPT = """You are an Incident Root Cause Agent. Your job is to diagnose
production incidents by investigating logs, metrics, and service dependencies.

Follow the scientific method:
1. Observe: Parse logs from the affected service to understand symptoms
2. Explore: Check service dependencies and correlate events across services
3. Hypothesize: Form ranked hypotheses about the root cause
4. Test: Search for specific evidence that confirms or refutes each hypothesis
5. Conclude: When a hypothesis is supported, dig deeper to find the specific trigger
6. Report: Generate an incident timeline from root cause to user impact

Key principles:
- Correlation is not causation: always verify with specific evidence
- Follow the dependency chain: if Service A depends on B, check B first
- Check for recent deployments and config changes near the incident time
- The root cause is usually the EARLIEST error in the causal chain"""

def investigate_incident(description: str, max_steps: int = 15) -> str:
    messages = [
        {"role": "system", "content": SYSTEM_PROMPT},
        {"role": "user", "content": f"Investigate this incident: {description}"}
    ]
    for step in range(max_steps):
        resp = client.chat.completions.create(
            model="gpt-4o", messages=messages,
            tools=tools, tool_choice="auto"
        )
        msg = resp.choices[0].message
        messages.append(msg)
        if not msg.tool_calls:
            return msg.content
        for tc in msg.tool_calls:
            fn = tc.function.name
            args = json.loads(tc.function.arguments)
            print(f"  [{step+1}] {fn}")
            result = TOOL_MAP[fn](args)
            messages.append({"role": "tool", "tool_call_id": tc.id, "content": result})
    return "Investigation reached step limit."

# ── Run ──
finding = investigate_incident(
    "API gateway started returning HTTP 500 errors at 14:35. "
    "Error rate jumped from 0.1% to 23%. Users cannot log in. "
    "Services involved: api-gateway, auth-service, redis, database."
)
print(finding)
07. Key Takeaways
-
Hypothesis-driven investigation is faster than exhaustive log search — the agent narrows the search space with each test
-
Temporal correlation is the primary signal: errors in a dependency that precede errors in the caller suggest causation
-
Always check for recent deployments and config changes near the incident time — they are the most common root causes
-
The dependency graph is essential: the agent must know that api-gateway depends on auth-service depends on redis to follow the causal chain
-
The root cause is usually the EARLIEST error in the chain, not the most visible one (the API 500s are symptoms, not the cause)
-
In production, connect this agent to real observability APIs (Datadog, Splunk, CloudWatch) instead of the simulated log store
-
Loghub provides free, real-world log data for testing: Apache, HDFS, OpenStack logs with genuine error patterns
-
The incident timeline is the most valuable output — it documents the causal chain for post-mortems and prevents repeat incidents