01. The Problem
There are over 300,000 datasets on data.gov alone. The US government publishes data on everything from air quality to hospital readmission rates to farm subsidies. The Census Bureau, Bureau of Labor Statistics, EPA, and dozens of other agencies all have their own APIs. For journalists, researchers, and policy analysts, the sheer volume makes it nearly impossible to know what is available, let alone find the specific dataset that answers their question.
Discovery is fragmented. Each agency uses different data formats (CSV, JSON, XML, shapefiles), different APIs (CKAN, REST, SOAP), different metadata standards, and different update schedules. A question like "How has air quality changed in counties with high poverty rates?" requires joining data from the EPA, Census Bureau, and BLS — three different APIs with three different schemas.
Analysis requires domain expertise. Once you find the data, you need to clean it, understand its limitations (sampling methodology, margin of error, vintage), run appropriate statistical tests, and interpret the results in context. A naive analysis of CDC mortality data without understanding age-adjustment will produce misleading conclusions.
The investigation is exploratory. A journalist investigating hospital safety does not know in advance which datasets will be relevant. They might start with CMS Hospital Compare data, find an anomaly in readmission rates in rural hospitals, pivot to Census poverty data for those counties, discover a correlation, then check BLS employment data for healthcare workers in the same areas. This branching, discovery-driven process is what makes an agent the right architecture.
02. Why an Agent
Why not a dashboard? Dashboards show pre-selected metrics from pre-selected datasets. They cannot discover new datasets, join across agencies, or follow an investigative thread. The user must already know what they are looking for — the agent can explore and surprise.
Why not a notebook? Notebooks require the analyst to write code for each step: API calls, data cleaning, analysis, visualization. The agent automates the mechanical parts (API calls, data loading, basic statistics) while using the LLM to guide the investigation — deciding what to look at next based on what it has found so far.
Why an agent? The investigative workflow is inherently non-linear:
- Search and discover — The agent searches data catalogs with natural language queries, finding datasets the user did not know existed.
- Download and profile — It downloads datasets, inspects their schema, and summarizes what is available before committing to a full analysis.
- Analyze and detect — It runs statistical analysis (trends, correlations, distributions) and flags anomalies that warrant investigation.
- Branch on findings — When it finds something interesting (e.g., a county with unusually high hospital readmission rates), it searches for related datasets to investigate the finding further.
- Synthesize — It generates a narrative that connects the findings across multiple datasets into a coherent story, with citations to the specific data sources.
Architecture Diagram
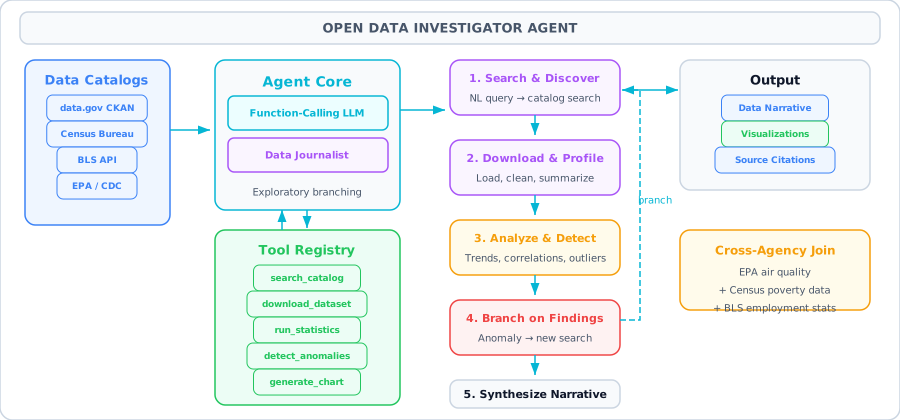
03. Architecture
Catalog Searcher
Searches the data.gov CKAN API and other catalogs with natural language queries. Returns dataset metadata including title, description, agency, format, update frequency, and download URLs.
Dataset Downloader
Downloads datasets from URLs, handles multiple formats (CSV, JSON, Excel, ZIP), and loads them into pandas DataFrames. Applies basic cleaning: header detection, encoding fixes, type inference.
Statistical Analyzer
Runs descriptive statistics, trend analysis (linear regression over time), correlation matrices, and distribution tests. Returns structured results that the LLM can interpret and report on.
Anomaly Detector
Identifies statistical anomalies: outlier values, trend breaks, unusual distributions, and geographic clusters. Flags findings with confidence levels and contextual information.
Chart Generator
Creates matplotlib visualizations: time series, scatter plots, choropleth maps, bar charts. Saves charts as images and returns file paths for inclusion in the narrative.
Narrative Writer
Uses the LLM to synthesize findings into a structured narrative with sections, citations, and embedded charts. Targets a journalistic style: lead with the most newsworthy finding.
04. Tools & APIs
Tool definitions using real government APIs. The data.gov CKAN API is free, requires no authentication, and provides access to hundreds of thousands of datasets.
import json, requests
import pandas as pd
import numpy as np
import matplotlib.pyplot as plt
from scipy import stats
from openai import OpenAI

client = OpenAI()

# ── Tool Definitions ──
tools = [
    {
        "type": "function",
        "function": {
            "name": "search_catalog",
            "description": "Search data.gov CKAN catalog for datasets matching a query. Returns dataset titles, descriptions, formats, and download URLs.",
            "parameters": {
                "type": "object",
                "properties": {
                    "query": {"type": "string", "description": "Natural language search query"},
                    "max_results": {"type": "integer", "description": "Max datasets to return (default 5)"}
                },
                "required": ["query"]
            }
        }
    },
    {
        "type": "function",
        "function": {
            "name": "download_dataset",
            "description": "Download a dataset from a URL and load it into memory. Returns schema, row count, and sample rows.",
            "parameters": {
                "type": "object",
                "properties": {
                    "url": {"type": "string", "description": "Download URL for the dataset"},
                    "dataset_id": {"type": "string", "description": "Unique ID to reference this dataset later"}
                },
                "required": ["url", "dataset_id"]
            }
        }
    },
    {
        "type": "function",
        "function": {
            "name": "run_analysis",
            "description": "Run statistical analysis on a loaded dataset: descriptive stats, trends, correlations, or group comparisons.",
            "parameters": {
                "type": "object",
                "properties": {
                    "dataset_id": {"type": "string"},
                    "analysis_type": {
                        "type": "string",
                        "enum": ["descriptive", "trend", "correlation", "group_comparison"]
                    },
                    "columns": {"type": "array", "items": {"type": "string"}},
                    "group_by": {"type": "string", "description": "Column to group by for comparisons"}
                },
                "required": ["dataset_id", "analysis_type"]
            }
        }
    },
    {
        "type": "function",
        "function": {
            "name": "detect_anomaly",
            "description": "Detect anomalies in a dataset column: outliers, trend breaks, or unusual distributions.",
            "parameters": {
                "type": "object",
                "properties": {
                    "dataset_id": {"type": "string"},
                    "column": {"type": "string"},
                    "method": {"type": "string", "enum": ["zscore", "iqr", "trend_break"]}
                },
                "required": ["dataset_id", "column"]
            }
        }
    },
    {
        "type": "function",
        "function": {
            "name": "generate_chart",
            "description": "Generate a chart (line, bar, scatter, histogram) from a dataset and save as PNG.",
            "parameters": {
                "type": "object",
                "properties": {
                    "dataset_id": {"type": "string"},
                    "chart_type": {"type": "string", "enum": ["line", "bar", "scatter", "histogram"]},
                    "x_column": {"type": "string"},
                    "y_column": {"type": "string"},
                    "title": {"type": "string"}
                },
                "required": ["dataset_id", "chart_type", "x_column", "y_column"]
            }
        }
    },
    {
        "type": "function",
        "function": {
            "name": "write_narrative",
            "description": "Synthesize findings into a structured narrative with sections, data citations, and embedded chart references.",
            "parameters": {
                "type": "object",
                "properties": {
                    "headline": {"type": "string"},
                    "findings": {"type": "array", "items": {"type": "object"}},
                    "datasets_used": {"type": "array", "items": {"type": "string"}}
                },
                "required": ["headline", "findings"]
            }
        }
    }
]
05. The Agent Loop
The investigator agent follows an exploratory branching loop. Unlike agents with a fixed workflow, this agent dynamically decides what to investigate next based on what it finds.
- Search — The user provides a topic (e.g., "hospital safety in rural areas"). The agent searches data.gov for relevant datasets.
- Download and Profile — The agent downloads the most promising datasets, inspects their schemas, and determines which columns are relevant.
- Analyze — The agent runs descriptive statistics on key columns, looking for patterns, trends, and distributions.
- Detect Anomalies — The agent flags statistical anomalies: counties with unusually high/low values, trend breaks that coincide with policy changes, unexpected correlations.
- Branch — When an anomaly is found, the agent decides whether to investigate further. If the finding is interesting, it searches for related datasets that might explain the anomaly.
- Correlate — The agent joins datasets (e.g., hospital readmission rates with county poverty levels) and tests for correlations.
- Visualize — The agent generates charts for key findings: trend lines, scatter plots showing correlations, bar charts comparing groups.
- Narrate — Finally, the agent writes a data-driven narrative that connects the findings into a coherent story.
Why branching? A journalist investigating hospital safety might start with CMS data and discover that rural hospitals in Appalachian states have readmission rates 40% above the national average. This finding triggers a branch: search for poverty data in those counties. The correlation between poverty and readmission rates then triggers another branch: check healthcare worker shortage data. The agent follows the story wherever the data leads.
06. Code Walkthrough
Complete implementation with real data.gov CKAN API calls, statistical analysis, and chart generation.
import json, requests, os
import pandas as pd
import numpy as np
import matplotlib
matplotlib.use("Agg")  # Non-interactive backend
import matplotlib.pyplot as plt
from scipy import stats
from openai import OpenAI

client = OpenAI()
datasets = {}  # In-memory store: dataset_id -> DataFrame
charts = []    # List of generated chart paths

# ── Tool Implementations ──
def search_catalog(query: str, max_results: int = 5) -> str:
    """Search data.gov CKAN API for datasets."""
    url = "https://catalog.data.gov/api/3/action/package_search"
    params = {"q": query, "rows": max_results}
    try:
        resp = requests.get(url, params=params, timeout=15)
        data = resp.json()
        results = []
        for pkg in data["result"]["results"]:
            resources = [r for r in pkg.get("resources", [])
                         if r.get("format", "").upper() in ("CSV", "JSON")]
            results.append({
                "title": pkg["title"],
                "description": pkg.get("notes", "")[:200],
                "organization": pkg.get("organization", {}).get("title", "Unknown"),
                "formats": [r.get("format") for r in resources],
                "download_urls": [r.get("url") for r in resources[:3]],
            })
        return json.dumps({"count": data["result"]["count"], "results": results})
    except Exception as e:
        return json.dumps({"error": str(e)})

def download_dataset(url: str, dataset_id: str) -> str:
    """Download a CSV/JSON dataset and load into memory."""
    try:
        if url.endswith(".json"):
            df = pd.read_json(url)
        else:
            df = pd.read_csv(url, nrows=10000)  # Limit for safety
        datasets[dataset_id] = df
        return json.dumps({
            "dataset_id": dataset_id,
            "rows": len(df), "columns": list(df.columns),
            "dtypes": {col: str(dt) for col, dt in df.dtypes.items()},
            "sample": df.head(3).to_dict(orient="records")
        })
    except Exception as e:
        return json.dumps({"error": str(e)})

def run_analysis(dataset_id: str, analysis_type: str,
                 columns: list = None, group_by: str = None) -> str:
    """Run statistical analysis on a loaded dataset."""
    df = datasets.get(dataset_id)
    if df is None:
        return json.dumps({"error": f"Dataset '{dataset_id}' not loaded"})
    cols = columns or df.select_dtypes(include=[np.number]).columns.tolist()

    if analysis_type == "descriptive":
        result = df[cols].describe().to_dict()
    elif analysis_type == "trend" and len(cols) >= 2:
        x, y = df[cols[0]].dropna(), df[cols[1]].dropna()
        common = x.index.intersection(y.index)
        slope, intercept, r, p, se = stats.linregress(x[common], y[common])
        result = {"slope": round(slope, 4), "r_squared": round(r**2, 4),
                  "p_value": round(p, 6), "significant": p < 0.05}
    elif analysis_type == "correlation":
        corr = df[cols].corr()
        # Find top correlations (exclude self-correlation)
        pairs = []
        for i in range(len(corr.columns)):
            for j in range(i+1, len(corr.columns)):
                pairs.append({
                    "col_a": corr.columns[i], "col_b": corr.columns[j],
                    "correlation": round(corr.iloc[i, j], 4)
                })
        pairs.sort(key=lambda x: abs(x["correlation"]), reverse=True)
        result = {"top_correlations": pairs[:10]}
    elif analysis_type == "group_comparison" and group_by:
        grouped = df.groupby(group_by)[cols].mean()
        result = {"groups": grouped.head(20).to_dict()}
    else:
        result = {"error": "Invalid analysis type or missing columns"}

    return json.dumps(result, default=str)

def detect_anomaly(dataset_id: str, column: str, method: str = "zscore") -> str:
    """Detect anomalies in a dataset column."""
    df = datasets.get(dataset_id)
    if df is None:
        return json.dumps({"error": "Dataset not loaded"})
    series = pd.to_numeric(df[column], errors="coerce").dropna()

    if method == "zscore":
        z = np.abs(stats.zscore(series))
        anomalies = series[z > 3]
    elif method == "iqr":
        q1, q3 = series.quantile([0.25, 0.75])
        iqr = q3 - q1
        anomalies = series[(series < q1 - 1.5*iqr) | (series > q3 + 1.5*iqr)]
    elif method == "trend_break":
        rolling_mean = series.rolling(10).mean()
        deviations = (series - rolling_mean).abs()
        threshold = deviations.mean() + 2 * deviations.std()
        anomalies = series[deviations > threshold]
    else:
        return json.dumps({"error": "Unknown method"})

    return json.dumps({
        "column": column, "method": method,
        "total_values": len(series),
        "anomaly_count": len(anomalies),
        "anomaly_pct": round(len(anomalies) / len(series) * 100, 2),
        "sample_anomalies": anomalies.head(5).tolist(),
        "normal_mean": round(series.mean(), 2),
        "normal_std": round(series.std(), 2)
    })

def generate_chart(dataset_id: str, chart_type: str,
                    x_column: str, y_column: str, title: str = "") -> str:
    """Generate a matplotlib chart and save as PNG."""
    df = datasets.get(dataset_id)
    if df is None:
        return json.dumps({"error": "Dataset not loaded"})
    fig, ax = plt.subplots(figsize=(10, 6))
    if chart_type == "line":
        ax.plot(df[x_column], df[y_column])
    elif chart_type == "bar":
        ax.bar(df[x_column].head(20), df[y_column].head(20))
        plt.xticks(rotation=45, ha="right")
    elif chart_type == "scatter":
        ax.scatter(df[x_column], df[y_column], alpha=0.5)
    elif chart_type == "histogram":
        ax.hist(df[y_column].dropna(), bins=30)

    ax.set_xlabel(x_column)
    ax.set_ylabel(y_column)
    ax.set_title(title or f"{y_column} by {x_column}")
    plt.tight_layout()
    path = f"charts/{dataset_id}_{chart_type}.png"
    os.makedirs("charts", exist_ok=True)
    fig.savefig(path, dpi=150)
    plt.close(fig)
    charts.append(path)
    return json.dumps({"chart_path": path, "chart_type": chart_type})

def write_narrative(headline: str, findings: list, datasets_used: list = None) -> str:
    """Generate a narrative report from findings."""
    prompt = f"""Write a data-driven investigative narrative.
Headline: {headline}
Findings: {json.dumps(findings)}
Datasets used: {json.dumps(datasets_used or [])}

Write in journalistic style. Lead with the most newsworthy finding.
Include specific numbers. Cite dataset sources. 300-500 words."""
    resp = client.chat.completions.create(
        model="gpt-4o",
        messages=[{"role": "user", "content": prompt}]
    )
    return resp.choices[0].message.content
The agent loop with the investigative system prompt:
# ── Agent Loop ──
TOOL_MAP = {
    "search_catalog": lambda a: search_catalog(a["query"], a.get("max_results", 5)),
    "download_dataset": lambda a: download_dataset(a["url"], a["dataset_id"]),
    "run_analysis": lambda a: run_analysis(a["dataset_id"], a["analysis_type"],
                                            a.get("columns"), a.get("group_by")),
    "detect_anomaly": lambda a: detect_anomaly(a["dataset_id"], a["column"],
                                               a.get("method", "zscore")),
    "generate_chart": lambda a: generate_chart(a["dataset_id"], a["chart_type"],
                                               a["x_column"], a["y_column"],
                                               a.get("title", "")),
    "write_narrative": lambda a: write_narrative(a["headline"], a["findings"],
                                                a.get("datasets_used")),
}

SYSTEM_PROMPT = """You are an Open Data Investigator Agent. Your job is to explore
government datasets and find newsworthy stories in the data.

Workflow:
1. Search data.gov for datasets related to the user's topic
2. Download the most promising datasets (prefer CSV format)
3. Run descriptive analysis to understand the data
4. Detect anomalies — look for surprising patterns, outliers, trend breaks
5. When you find something interesting, search for related datasets to investigate
6. Generate charts for key findings
7. Write a narrative that connects findings into a story

Be curious: follow the data wherever it leads. Always cite specific numbers.
When you find an anomaly, ask 'why?' and search for explanatory datasets.
Stop after investigating 2-3 datasets or 15 tool calls."""

def run_investigator(topic: str, max_steps: int = 15) -> str:
    messages = [
        {"role": "system", "content": SYSTEM_PROMPT},
        {"role": "user", "content": f"Investigate: {topic}"}
    ]

    for step in range(max_steps):
        resp = client.chat.completions.create(
            model="gpt-4o", messages=messages,
            tools=tools, tool_choice="auto"
        )
        msg = resp.choices[0].message
        messages.append(msg)

        if not msg.tool_calls:
            return msg.content

        for tc in msg.tool_calls:
            fn = tc.function.name
            args = json.loads(tc.function.arguments)
            print(f"  [{step+1}] {fn}({list(args.keys())})")
            result = TOOL_MAP[fn](args)
            messages.append({
                "role": "tool", "tool_call_id": tc.id, "content": result
            })

    return "Investigation reached step limit."

# ── Run ──
story = run_investigator(
    "Air quality trends in US counties with high poverty rates. "
    "Are disadvantaged communities disproportionately affected by pollution?"
)
print(story)
07. Key Takeaways
-
The data.gov CKAN API is free, requires no authentication, and provides access to 300,000+ datasets — an ideal playground for data agents
-
Exploratory data analysis is inherently non-linear: findings in one dataset trigger investigation of related datasets
-
Always limit dataset downloads (nrows=10000) to prevent memory issues — the agent can request more rows if needed
-
Statistical anomalies are not stories until explained: the agent must search for causal factors, not just report numbers
-
Chart generation with matplotlib's Agg backend works in headless environments (Colab, servers) without display issues
-
The narrative writer tool uses the LLM itself — this is a pattern where one tool call triggers another LLM call with a specialized prompt
-
Data journalism requires citing sources: every number in the narrative must trace back to a specific dataset and column
-
This pattern extends to any domain with large open data: scientific research, market analysis, urban planning