01. The Problem
People do not know where their money goes. A 2024 Bankrate survey found that 56% of Americans cannot cover a $1,000 emergency expense. Yet most people earn enough — the problem is not income, it is visibility. Transaction data is scattered across checking accounts, credit cards, Venmo, subscriptions, and cash purchases. Without aggregation and categorization, spending patterns are invisible.
Generic budgets do not work. The "50/30/20 rule" (50% needs, 30% wants, 20% savings) is a starting point, but it ignores individual circumstances. A software engineer in San Francisco paying $3,500/month rent cannot allocate the same percentage to housing as someone in Omaha paying $900. Effective budgets must be personalized based on actual spending patterns, income, location, and goals.
Advice must be actionable. "Spend less on dining out" is not actionable. "You spent $847 on DoorDash last month, which is 3.2x the national median for your income bracket. Reducing to 2 orders per week would save $423/month, reaching your $5,000 emergency fund in 12 months" — that is actionable.
Data sources: We use Kaggle synthetic transaction datasets that mimic real bank transaction data (merchant names, amounts, categories, timestamps). For benchmarks, we reference the BLS Consumer Expenditure Survey, which provides average spending by income quintile across 14 categories.
02. Why an Agent
Why not a budgeting app? Apps like Mint and YNAB categorize transactions and show charts, but they do not reason about your spending. They cannot explain why your food spending spiked in December (holiday entertaining), or suggest that your gym membership plus ClassPass subscription is redundant. An LLM can reason about spending semantics.
Why not a single LLM call? Financial analysis requires multiple steps: categorize transactions, aggregate by category and time period, compare against benchmarks, identify savings opportunities, create a budget, and project outcomes. Each step depends on the prior step's output. The full transaction history may also exceed context limits.
Why an agent? The analysis-to-advice pipeline requires sequential reasoning with tools:
- Categorize — Use the LLM to categorize ambiguous transactions (is "AMZN Mktp" groceries, electronics, or household supplies?) based on amount, frequency, and merchant patterns.
- Analyze patterns — Compute monthly averages, detect trends (is spending increasing?), find recurring charges (subscriptions), and flag anomalies (unusually large transactions).
- Compare to benchmarks — Pull BLS Consumer Expenditure Survey data for the user's income bracket and compare category-by-category. This contextualizes spending: "You spend 2x the median on dining out, but 0.5x on transportation."
- Create budget — Based on current spending, benchmarks, and the user's goals, create a personalized budget that is realistic (not slashing 50% from every category) and prioritized (cut the highest-impact categories first).
- Project savings — Model how the budget would affect savings over 3, 6, and 12 months, accounting for irregular expenses and seasonal variations.
- Generate advice — Produce specific, actionable recommendations with dollar amounts and timelines.
Architecture Diagram
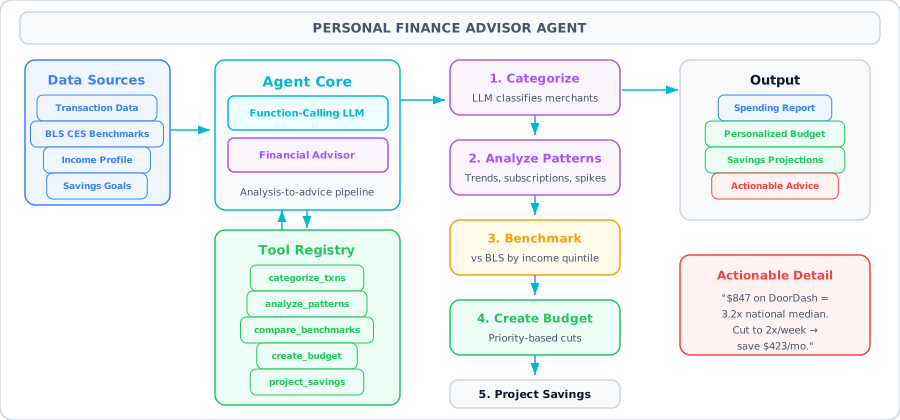
03. Architecture
Transaction Categorizer
Classifies transactions into spending categories (Housing, Food, Transport, Entertainment, etc.) using merchant name patterns, amount ranges, and LLM reasoning for ambiguous entries. Handles edge cases like split transactions.
Pattern Analyzer
Computes monthly spending by category, detects trends (increasing/decreasing), identifies recurring charges (subscriptions, memberships), and flags anomalies (transactions 3x above category average).
Benchmark Comparator
Compares the user's spending against BLS Consumer Expenditure Survey data, segmented by income quintile. Returns a category-by-category comparison showing where the user is above or below the national median.
Budget Creator
Generates a personalized monthly budget based on income, current spending, benchmarks, and stated goals. Uses a priority-based approach: cuts come from the highest-delta categories first.
Savings Projector
Models savings trajectories under different scenarios (current spending, proposed budget, aggressive savings). Accounts for irregular expenses (annual insurance, holidays) and compound interest on savings.
Advice Generator
Produces personalized, actionable financial advice with specific dollar amounts, merchant-level recommendations, and timelines. References benchmark data to justify each suggestion.
04. Tools & APIs
Tool definitions for the finance advisor agent. Each tool operates on transaction data loaded from a CSV file.
import json
import pandas as pd
import numpy as np
from openai import OpenAI

client = OpenAI()

# ── Tool Definitions ──
tools = [
    {
        "type": "function",
        "function": {
            "name": "categorize_transactions",
            "description": "Categorize transactions into spending categories (Housing, Food, Transport, etc.). Returns categorized data with monthly totals.",
            "parameters": {
                "type": "object",
                "properties": {
                    "recategorize": {
                        "type": "boolean",
                        "description": "Force re-categorization of all transactions"
                    }
                },
                "required": []
            }
        }
    },
    {
        "type": "function",
        "function": {
            "name": "analyze_patterns",
            "description": "Analyze spending patterns: monthly trends, recurring charges (subscriptions), anomalies, and day-of-week patterns.",
            "parameters": {
                "type": "object",
                "properties": {
                    "category": {"type": "string", "description": "Specific category to analyze, or 'all'"},
                    "months": {"type": "integer", "description": "Number of months to analyze (default 6)"}
                },
                "required": []
            }
        }
    },
    {
        "type": "function",
        "function": {
            "name": "compare_benchmarks",
            "description": "Compare spending against BLS Consumer Expenditure Survey benchmarks for the user's income bracket.",
            "parameters": {
                "type": "object",
                "properties": {
                    "annual_income": {"type": "number", "description": "User's annual pre-tax income"},
                    "location": {"type": "string", "description": "City/region for cost-of-living adjustment"}
                },
                "required": ["annual_income"]
            }
        }
    },
    {
        "type": "function",
        "function": {
            "name": "create_budget",
            "description": "Create a personalized monthly budget based on income, current spending, benchmarks, and savings goal.",
            "parameters": {
                "type": "object",
                "properties": {
                    "monthly_income": {"type": "number"},
                    "savings_goal_pct": {"type": "number", "description": "Target savings as % of income (default 20)"},
                    "fixed_expenses": {"type": "object", "description": "Fixed expenses that cannot be reduced, e.g. {'rent': 2000, 'insurance': 300}"}
                },
                "required": ["monthly_income"]
            }
        }
    },
    {
        "type": "function",
        "function": {
            "name": "project_savings",
            "description": "Project savings over time under current vs. proposed budget. Shows 3, 6, and 12 month trajectories.",
            "parameters": {
                "type": "object",
                "properties": {
                    "current_savings": {"type": "number", "description": "Current savings balance"},
                    "monthly_savings_current": {"type": "number", "description": "Current monthly savings rate"},
                    "monthly_savings_proposed": {"type": "number", "description": "Proposed monthly savings rate"},
                    "savings_goal": {"type": "number", "description": "Target savings amount"}
                },
                "required": ["current_savings", "monthly_savings_current", "monthly_savings_proposed"]
            }
        }
    },
    {
        "type": "function",
        "function": {
            "name": "generate_advice",
            "description": "Generate personalized, actionable financial advice based on analysis results.",
            "parameters": {
                "type": "object",
                "properties": {
                    "spending_summary": {"type": "object", "description": "Monthly spending by category"},
                    "benchmark_comparison": {"type": "object", "description": "How spending compares to benchmarks"},
                    "goals": {"type": "string", "description": "User's financial goals"}
                },
                "required": ["spending_summary"]
            }
        }
    }
]
05. The Agent Loop
The finance advisor agent follows an analysis-to-advice pipeline — a structured sequence where each step depends on the previous step's output, but the agent can loop back if it needs more detail on a specific category.
- Categorize — The agent calls
categorize_transactionsto classify all transactions into spending categories. Ambiguous transactions (e.g., Amazon, which could be groceries, electronics, or household) are resolved using the LLM's reasoning about amount and frequency. - Analyze Patterns — The agent calls
analyze_patternsto identify monthly trends, recurring subscriptions, and anomalies. This step often reveals hidden spending: subscriptions the user forgot about, gradual increases in specific categories. - Compare Benchmarks — The agent calls
compare_benchmarkswith the user's income level to contextualize spending. "You spend $1,200/month on food" means nothing in isolation; "$1,200/month is 2.3x the BLS median for your income bracket" is informative. - Create Budget — Based on current spending and benchmarks, the agent calls
create_budgetto generate a personalized budget. The budget respects fixed expenses (rent, insurance) and prioritizes cuts in the categories with the highest above-benchmark spending. - Project Savings — The agent calls
project_savingsto model what the proposed budget would achieve: "At current spending, you save $200/month and reach your $5,000 emergency fund in 25 months. With the proposed budget, you save $650/month and reach it in 7.7 months." - Generate Advice — Finally, the agent calls
generate_adviceto produce specific, actionable recommendations with dollar amounts and timelines.
Why a pipeline? Unlike the exploratory agents (Open Data Investigator) or iterative agents (Data Quality), financial advice follows a natural logical sequence: you must understand spending before you can compare it, compare before you can budget, and budget before you can project. The agent can still loop back — if benchmark comparison reveals an anomaly in a specific category, the agent may re-analyze that category in more detail.
06. Code Walkthrough
Complete implementation with synthetic transaction data, BLS benchmark comparison, and the full analysis-to-advice pipeline.
import json
import pandas as pd
import numpy as np
from datetime import datetime, timedelta
from openai import OpenAI

client = OpenAI()

# ── Generate Synthetic Transaction Data ──
np.random.seed(42)
n_transactions = 500

merchants = {
    "Housing": [("Rent Payment", 2200, 2200), ("Electric Co", 80, 180),
                ("Water Utility", 40, 70)],
    "Food": [("Whole Foods", 30, 150), ("DoorDash", 15, 55),
             ("Starbucks", 4, 12), ("Trader Joes", 25, 100)],
    "Transport": [("Shell Gas", 35, 65), ("Uber", 10, 40),
                  ("Metro Card", 127, 127)],
    "Entertainment": [("Netflix", 15.49, 15.49), ("Spotify", 10.99, 10.99),
                      ("AMC Theatres", 14, 30), ("Steam Games", 10, 60)],
    "Shopping": [("Amazon", 10, 200), ("Target", 15, 120),
                ("Nike.com", 50, 180)],
    "Health": [("CVS Pharmacy", 8, 50), ("Gym Membership", 49.99, 49.99),
              ("ClassPass", 29, 29)],
    "Subscriptions": [("iCloud Storage", 2.99, 2.99), ("NYT Digital", 17, 17),
                      ("ChatGPT Plus", 20, 20)],
}

rows = []
base_date = datetime(2024, 7, 1)
for _ in range(n_transactions):
    cat = np.random.choice(list(merchants.keys()),
                            p=[0.08, 0.30, 0.12, 0.10, 0.18, 0.10, 0.12])
    merch, lo, hi = merchants[cat][np.random.randint(len(merchants[cat]))]
    amount = round(np.random.uniform(lo, hi), 2)
    date = base_date + timedelta(days=np.random.randint(0, 180))
    rows.append({"date": date.strftime("%Y-%m-%d"), "merchant": merch,
               "amount": amount, "category": cat})

df = pd.DataFrame(rows)
df["date"] = pd.to_datetime(df["date"])
df = df.sort_values("date").reset_index(drop=True)

# ── BLS Consumer Expenditure Survey Benchmarks (2023, monthly) ──
# Source: https://www.bls.gov/cex/
BLS_BENCHMARKS = {
    # Income quintile: $50k-$80k (3rd quintile)
    "quintile_3": {
        "Housing": 1784, "Food": 695, "Transport": 870,
        "Entertainment": 243, "Shopping": 156,
        "Health": 415, "Subscriptions": 50
    },
    # Income quintile: $80k-$130k (4th quintile)
    "quintile_4": {
        "Housing": 2340, "Food": 890, "Transport": 1100,
        "Entertainment": 340, "Shopping": 220,
        "Health": 520, "Subscriptions": 65
    }
}

# ── Tool Implementations ──
def categorize_transactions(recategorize: bool = False) -> str:
    """Return categorized transaction summary."""
    monthly = df.groupby([df["date"].dt.to_period("M"), "category"])["amount"].sum()
    monthly = monthly.unstack(fill_value=0)
    avg_monthly = monthly.mean().to_dict()
    total_monthly = round(sum(avg_monthly.values()), 2)
    return json.dumps({
        "total_transactions": len(df),
        "date_range": f"{df['date'].min().date()} to {df['date'].max().date()}",
        "avg_monthly_by_category": {k: round(v, 2) for k, v in avg_monthly.items()},
        "avg_monthly_total": total_monthly,
        "top_merchants": df.groupby("merchant")["amount"].sum().nlargest(10).to_dict(),
        "category_counts": df["category"].value_counts().to_dict()
    }, indent=2)

def analyze_patterns(category: str = "all", months: int = 6) -> str:
    """Analyze spending patterns, trends, and recurring charges."""
    data = df if category == "all" else df[df["category"] == category]
    monthly_total = data.groupby(data["date"].dt.to_period("M"))["amount"].sum()

    # Detect trend
    if len(monthly_total) >= 3:
        x = np.arange(len(monthly_total))
        slope = np.polyfit(x, monthly_total.values, 1)[0]
        trend = "increasing" if slope > 20 else "decreasing" if slope < -20 else "stable"
    else:
        trend, slope = "insufficient_data", 0

    # Detect recurring charges (same merchant, similar amount, monthly)
    recurring = []
    for merchant, group in data.groupby("merchant"):
        if len(group) >= 3:
            amounts = group["amount"].values
            if np.std(amounts) < 1.0:  # Same amount each time
                recurring.append({
                    "merchant": merchant,
                    "amount": round(float(np.mean(amounts)), 2),
                    "frequency": "monthly",
                    "annual_cost": round(float(np.mean(amounts)) * 12, 2)
                })

    # Detect anomalies
    mean_txn = data["amount"].mean()
    std_txn = data["amount"].std()
    anomalies = data[data["amount"] > mean_txn + 2 * std_txn]

    return json.dumps({
        "category": category,
        "monthly_spending": {str(k): round(v, 2) for k, v in monthly_total.items()},
        "trend": trend, "trend_slope_per_month": round(slope, 2),
        "recurring_charges": recurring,
        "total_recurring_monthly": round(sum(r["amount"] for r in recurring), 2),
        "anomalies": anomalies[["date", "merchant", "amount"]].head(5).to_dict(orient="records"),
    }, default=str)

def compare_benchmarks(annual_income: float, location: str = "") -> str:
    """Compare user's spending to BLS benchmarks."""
    quintile = "quintile_3" if annual_income < 80000 else "quintile_4"
    benchmarks = BLS_BENCHMARKS[quintile]
    monthly_avg = df.groupby("category")["amount"].sum() / 6  # 6 months of data
    comparison = {}
    for cat, benchmark in benchmarks.items():
        actual = round(monthly_avg.get(cat, 0), 2)
        ratio = round(actual / benchmark, 2) if benchmark > 0 else 0
        comparison[cat] = {
            "your_monthly": actual,
            "benchmark_monthly": benchmark,
            "ratio": ratio,
            "assessment": "above" if ratio > 1.2 else "below" if ratio < 0.8 else "on_track",
            "monthly_delta": round(actual - benchmark, 2)
        }
    return json.dumps({
        "income_quintile": quintile,
        "annual_income": annual_income,
        "comparison": comparison,
        "categories_above_benchmark": [c for c, v in comparison.items() if v["assessment"] == "above"],
        "potential_monthly_savings": round(sum(
            max(v["monthly_delta"], 0) for v in comparison.values()
        ), 2)
    }, indent=2)

def create_budget(monthly_income: float, savings_goal_pct: float = 20,
                  fixed_expenses: dict = None) -> str:
    """Create a personalized monthly budget."""
    fixed = fixed_expenses or {}
    savings_target = monthly_income * savings_goal_pct / 100
    discretionary = monthly_income - savings_target - sum(fixed.values())

    monthly_avg = df.groupby("category")["amount"].sum() / 6
    total_current = monthly_avg.sum()

    # Allocate budget proportionally but cap above-benchmark categories
    budget = {}
    for cat in monthly_avg.index:
        current = round(monthly_avg[cat], 2)
        if cat in fixed:
            budget[cat] = {"current": current, "proposed": fixed[cat], "type": "fixed"}
        else:
            # Reduce proportionally to hit savings target
            reduction_ratio = discretionary / (total_current - sum(fixed.values())) \
                if total_current > sum(fixed.values()) else 1.0
            proposed = round(current * min(reduction_ratio, 1.0), 2)
            budget[cat] = {
                "current": current, "proposed": proposed,
                "savings": round(current - proposed, 2), "type": "variable"
            }

    return json.dumps({
        "monthly_income": monthly_income,
        "savings_target": round(savings_target, 2),
        "budget": budget,
        "total_proposed_spending": round(sum(b["proposed"] for b in budget.values()), 2),
        "total_current_spending": round(total_current, 2),
        "monthly_savings_gain": round(total_current - sum(b["proposed"] for b in budget.values()), 2)
    }, indent=2)

def project_savings(current_savings: float, monthly_savings_current: float,
                     monthly_savings_proposed: float, savings_goal: float = 0) -> str:
    """Project savings trajectories under current vs proposed budget."""
    apy = 0.045  # 4.5% HYSA rate
    monthly_rate = apy / 12
    projections = {"current": [], "proposed": []}

    for scenario, monthly_add in [("current", monthly_savings_current),
                                   ("proposed", monthly_savings_proposed)]:
        balance = current_savings
        for month in range(1, 13):
            balance = balance * (1 + monthly_rate) + monthly_add
            projections[scenario].append({
                "month": month,
                "balance": round(balance, 2)
            })

    months_to_goal_current = None
    months_to_goal_proposed = None
    if savings_goal > 0:
        for p in projections["current"]:
            if p["balance"] >= savings_goal:
                months_to_goal_current = p["month"]
                break
        for p in projections["proposed"]:
            if p["balance"] >= savings_goal:
                months_to_goal_proposed = p["month"]
                break

    return json.dumps({
        "current_savings": current_savings,
        "apy": apy,
        "at_3_months": {
            "current": projections["current"][2]["balance"],
            "proposed": projections["proposed"][2]["balance"]
        },
        "at_6_months": {
            "current": projections["current"][5]["balance"],
            "proposed": projections["proposed"][5]["balance"]
        },
        "at_12_months": {
            "current": projections["current"][11]["balance"],
            "proposed": projections["proposed"][11]["balance"]
        },
        "savings_goal": savings_goal,
        "months_to_goal_current": months_to_goal_current or ">12",
        "months_to_goal_proposed": months_to_goal_proposed or ">12",
    }, indent=2)

def generate_advice(spending_summary: dict, benchmark_comparison: dict = None,
                    goals: str = "") -> str:
    """Generate personalized financial advice using the LLM."""
    prompt = f"""Based on this financial analysis, generate 5 specific, actionable
recommendations. Each must include:
- The specific action to take
- The dollar amount saved per month
- The timeline to see results

Spending: {json.dumps(spending_summary)}
Benchmarks: {json.dumps(benchmark_comparison or {})}
Goals: {goals or 'Build emergency fund, reduce unnecessary spending'}

Be specific about merchants and amounts. No generic advice."""
    resp = client.chat.completions.create(
        model="gpt-4o",
        messages=[{"role": "user", "content": prompt}],
        response_format={"type": "json_object"}
    )
    return resp.choices[0].message.content
The agent loop with the financial advisor system prompt:
# ── Agent Loop ──
TOOL_MAP = {
    "categorize_transactions": lambda a: categorize_transactions(a.get("recategorize", False)),
    "analyze_patterns": lambda a: analyze_patterns(a.get("category", "all"), a.get("months", 6)),
    "compare_benchmarks": lambda a: compare_benchmarks(a["annual_income"], a.get("location", "")),
    "create_budget": lambda a: create_budget(a["monthly_income"], a.get("savings_goal_pct", 20),
                                             a.get("fixed_expenses")),
    "project_savings": lambda a: project_savings(a["current_savings"], a["monthly_savings_current"],
                                                a["monthly_savings_proposed"], a.get("savings_goal", 0)),
    "generate_advice": lambda a: generate_advice(a["spending_summary"], a.get("benchmark_comparison"),
                                                a.get("goals", "")),
}

SYSTEM_PROMPT = """You are a Personal Finance Advisor Agent. Your job is to analyze
spending data and provide actionable financial advice.

Follow this pipeline:
1. Categorize transactions to understand spending patterns
2. Analyze patterns: trends, recurring charges, anomalies
3. Compare against BLS benchmarks for the user's income bracket
4. Create a personalized budget based on goals and current spending
5. Project savings under current vs. proposed budget
6. Generate specific, actionable advice with dollar amounts

Key principles:
- Be specific: name merchants and amounts, not generic categories
- Be realistic: don't suggest cutting 50% from every category
- Prioritize high-impact changes: focus on the biggest spending gaps
- Always contextualize with benchmarks: 'You spend 2x the median' is more
  persuasive than 'You spend $800 on food'
- This is NOT financial advice in a legal sense; always recommend
  consulting a financial advisor for major decisions."""

def run_finance_agent(request: str, max_steps: int = 12) -> str:
    messages = [
        {"role": "system", "content": SYSTEM_PROMPT},
        {"role": "user", "content": request}
    ]
    for step in range(max_steps):
        resp = client.chat.completions.create(
            model="gpt-4o", messages=messages,
            tools=tools, tool_choice="auto"
        )
        msg = resp.choices[0].message
        messages.append(msg)
        if not msg.tool_calls:
            return msg.content
        for tc in msg.tool_calls:
            fn = tc.function.name
            args = json.loads(tc.function.arguments)
            print(f"  [{step+1}] {fn}")
            result = TOOL_MAP[fn](args)
            messages.append({"role": "tool", "tool_call_id": tc.id, "content": result})
    return "Analysis complete."

# ── Run ──
advice = run_finance_agent(
    "I earn $85,000/year ($5,800/month after tax). I have $1,200 in savings "
    "and want to build a $5,000 emergency fund. My rent is $2,200/month "
    "and I can't reduce it. Analyze my spending, compare to benchmarks, "
    "create a realistic budget, and tell me how fast I can reach my goal."
)
print(advice)
07. Key Takeaways
-
Transaction categorization is the foundation: all downstream analysis depends on accurate categories, making LLM-based categorization critical for ambiguous merchants
-
Benchmarks transform raw numbers into insights: "$800/month on food" is meaningless without "that is 2x the BLS median for your income bracket"
-
Recurring charges (subscriptions) are the easiest wins: users often forget about $10-20/month subscriptions that add up to hundreds annually
-
Budgets must respect fixed expenses: the agent should never suggest reducing rent or insurance, only variable spending
-
Savings projections with compound interest (HYSA at 4.5%) make the case more compelling: "Your $650/month saves $8,100 in 12 months, not $7,800"
-
Advice must be specific and actionable: "Cancel DoorDash and cook 3 extra meals per week to save $423/month" beats "spend less on food"
-
Always include a disclaimer that this is not professional financial advice — the agent is a tool, not a fiduciary
-
The BLS Consumer Expenditure Survey is free, updated annually, and segments by income quintile — ideal for personalized benchmarking