Chapter 11 of 17
Operating AI at Scale
Shipping an AI feature is the beginning, not the end. This chapter gives product managers the monitoring frameworks, feedback loop designs, drift detection approaches, and incident response playbooks to keep AI features working — and the cost scaling models, rate limiting strategies, caching approaches, and international expansion considerations to keep them sustainable as they grow.
Overview
Why AI Features Need Different Operations
Traditional software features fail in obvious ways. A server goes down and users cannot load the page. A bug causes the checkout flow to throw an error. A form field stops saving data. These failures are binary, detectable, and usually self-evident — your alerting fires, an engineer gets paged, and the failure is investigated and fixed.
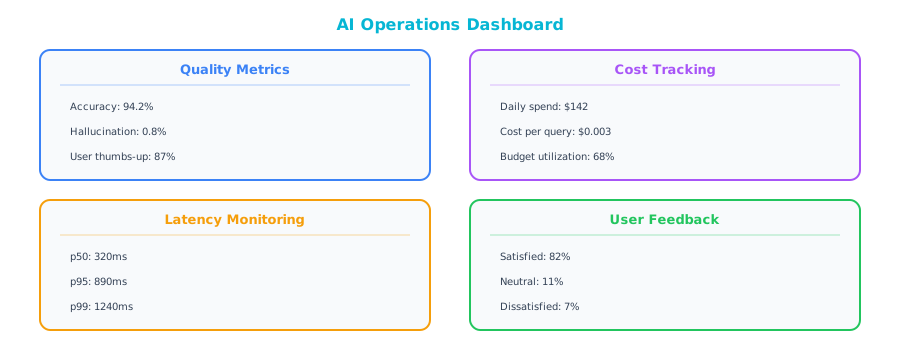
AI features fail in subtle ways. The system is up, the API is responding, and the feature is loading perfectly — but the outputs have gotten worse, gradually and quietly, without anyone noticing, and users have started to silently disengage. No alert fires and no engineer gets paged. The product just slowly becomes less useful, and by the time you notice, you have lost months of user trust.
And then, if the feature succeeds: the costs report comes in, and someone in finance sends a message: "We need to talk about the AI line item." Usage grew. But AI cost does not scale like database storage or CDN bandwidth. It scales differently, often faster, with different breakpoints, and with surprises that traditional infrastructure scaling never produced.
Operating AI in production requires two capabilities: monitoring quality continuously (not just availability), and managing costs as the feature scales. This chapter covers both.
Think of it like this: Monitoring a traditional feature is like monitoring a vending machine. You know it is broken when the customer does not get their snack and the display shows an error. Monitoring an AI feature is like monitoring a food delivery service. The driver shows up, the bag looks right, but the order might be wrong, cold, or missing items. You need a feedback mechanism that tracks whether customers are satisfied after the exchange, not just whether the exchange occurred.
What to Watch: The Four Monitoring Dimensions
1. Quality
Quality is the most important dimension and the one most commonly under-monitored at launch. Quality monitoring answers: Is the AI producing outputs that are useful and correct?
Metrics to track:
- Human evaluation sample rate: What percentage of AI outputs are manually reviewed by a human for quality? This does not need to be 100%. Even 0.5% of outputs can be statistically meaningful at scale. Define who does the review, how often, and what rubric they use.
- Correction rate: If your feature allows users to correct AI outputs, what percentage of outputs are being corrected? Rising correction rate is an early signal of quality degradation.
- Explicit rating scores: If you have built in thumbs up/down or star ratings, track these by feature, by user segment, by query type.
- Task completion rate: For AI features designed to help users accomplish a specific task, what percentage of the time does the user complete the task after the AI intervenes, vs. abandon or redo it manually?
- Output rejection rate: For AI suggestions that can be accepted or dismissed, the dismissal rate is a proxy quality signal.
Setting baselines: Establish these metrics during your canary or limited-launch phase, before full rollout, so you have a baseline to compare against. A 15% thumbs-down rate is meaningless without knowing whether it was 15% before, too.
2. Cost
Cost monitoring ensures your AI feature's economics remain viable as usage scales.
Metrics to track:
- Cost per call: Average and median cost per AI invocation, including all cost layers (model tokens, retrieval, infrastructure).
- Cost per monthly active user (MAU): Total AI cost divided by monthly active users on the feature. Watch for this growing faster than revenue.
- Cost trend: Is cost per call stable, declining (model costs are often falling), or rising (investigate, as this usually indicates prompt bloat or increased context length)?
- Cost by user percentile: What does the p90 and p99 user cost look like? If your top 1% of users account for 40% of your AI cost, you may have a rate limiting or cap problem.
- Forecast vs. actual: Compare your monthly AI cost forecast to actuals. Consistent overruns indicate your usage model is wrong.
Alert thresholds to set:
| Metric | Warning threshold | Critical threshold |
|---|---|---|
| Cost per MAU month-over-month change | +20% | +50% |
| AI cost as % of tier revenue | 20% | 35% |
| Single-user monthly AI cost | 5x average | 20x average |
3. Latency
Latency monitoring answers: Are users experiencing the AI feature at acceptable speed?
AI features are often inherently slower than traditional features. A database query takes milliseconds; an LLM inference call takes seconds. Users will tolerate some latency for sufficiently valuable AI outputs, but tolerance has limits.
Metrics to track:
- p50 latency: The median response time. This represents the typical user experience.
- p95 latency: The 95th-percentile response time. This represents what a user who is "unlucky" experiences.
- p99 latency: The 99th-percentile response time. This represents your worst cases.
- Timeout rate: What percentage of AI calls time out before returning?
Practical benchmarks (rough guidance, not standards):
| Feature type | Acceptable p50 | Acceptable p95 |
|---|---|---|
| Inline suggestion (autocomplete) | <500ms | <1,500ms |
| On-demand generation (write a draft) | <3s | <8s |
| Background processing (analyze document) | <30s | <90s |
| Async job (batch summarization) | Notification-based | N/A |
4. User Satisfaction
User satisfaction is the outcome metric that all the others ultimately serve. It answers: Are users actually happy with the AI experience?
Metrics to track:
- Feature NPS or satisfaction score: Segment responses by AI feature users vs. non-users to understand the AI feature's contribution to satisfaction.
- Support ticket volume and category: Are AI feature-related support tickets increasing?
- Feature retention: Are users who activate the AI feature more or less likely to be retained at 30, 60, and 90 days?
- Voluntary opt-out rate: What percentage of users who activated the feature later disabled it? High opt-out rates indicate the feature is not delivering on its promise.
Building Feedback Loops
Monitoring data is only valuable if it creates action. A feedback loop is the mechanism that turns user signals back into product improvement.
The four elements of a functional feedback loop are:
- Signal collection: The product captures user behavior or explicit ratings as feedback.
- Signal aggregation: The feedback is stored, structured, and surfaced to the team in usable form.
- Analysis and interpretation: The team reviews the feedback, identifies patterns, and forms hypotheses about what to fix.
- Model or product improvement: The team acts on the analysis by adjusting prompts, updating the model, changing the UI, or modifying the feature scope.
Most teams are reasonably good at steps 1 and 2. Steps 3 and 4 are where feedback loops die.
Designing Feedback Mechanisms
Thumbs up / thumbs down: Simple, high-volume, low-friction. Best for capturing gross quality signal. Limitation: does not tell you why something was good or bad.
Corrections and edits: If your AI feature produces text that users can edit, every edit is a feedback signal. Log diffs between AI outputs and final user versions.
Category-labeled flags: "This is wrong," "This is irrelevant," "This is inappropriate." These structured error categories give you actionable signal about what kind of quality issue you are seeing.
Post-task surveys: A brief survey shown after a user completes (or abandons) a task that involved the AI feature.
Escalations: Explicit pathways for users to report AI outputs that require human review. Every escalation is high-quality labeled data.
Implicit behavioral signals: Accept/reject, copy-to-clipboard, share, follow-through on AI recommendations. These require no action from the user and generate signal at high volume with low bias.
The Feedback Cadence
| Cadence | Activity | Owner |
|---|---|---|
| Daily | Review escalations and critical flags | PM + relevant expert |
| Weekly | Review quality metrics, error rates, top negative feedback categories | PM + ML/AI team |
| Monthly | Full quality audit: human evaluation sample, trend analysis, model improvement backlog | PM + ML/AI team |
| Quarterly | Strategic review: is the AI feature meeting its value hypothesis? | PM + leadership |
Drift Detection: When Your AI Feature Quietly Gets Worse
Drift is the phenomenon where an AI feature that was working well gradually degrades in quality without any explicit change to the system. It is one of the most insidious production problems in AI, because it can persist for weeks or months before anyone notices.
Input distribution shift: The inputs users are sending to your AI feature today are different from the inputs it was trained or tested on.
Reference data drift: Your AI feature may depend on data that gets updated over time, such as a knowledge base, a product catalog, or a set of rules.
Model provider changes: If you are using a hosted model API, the provider may have updated the underlying model without prominent notification.
Seasonal and behavioral changes: User behavior and language evolve over time.
How PMs Detect Drift
| Signal | What it looks like | What it might indicate |
|---|---|---|
| Slowly declining thumbs-up rate | Was 75%, now 65% over 8 weeks | Input distribution shift or model provider change |
| Rising correction rate | Users editing AI outputs more frequently | Quality degradation in specific output types |
| Increasing support tickets about AI accuracy | More "the AI got it wrong" tickets | Drift in a specific domain or query type |
| Feature usage plateau or decline | AI feature MAU flattening despite overall product growth | Users disengaging due to quality loss |
The Drift Investigation Checklist
When you suspect drift:
- Pull a manual sample of recent AI outputs and compare them to outputs from 60–90 days ago.
- Check whether the model provider has made any announced changes to the underlying model.
- Compare the distribution of input types over time. Has it shifted?
- Check whether your prompts, system instructions, or context data have changed.
- Run your evaluation suite against recent production samples and compare scores to historical baselines.
Incident Response: When the AI Says Something Wrong Publicly
Every AI product will eventually produce a bad output that gets noticed publicly. This is not a hypothetical. It is a when, not an if.
The AI Incident Response Playbook
Step 1: Contain (0–2 hours)
- Reproduce the issue to confirm it is real and understand its scope.
- Determine whether the issue is isolated or systemic.
- If systemic: implement a temporary mitigation. Disable the feature, add a guardrail, or route affected query types to a fallback.
- Communicate internally to legal, comms, customer success, and leadership.
Step 2: Assess (2–8 hours)
- How many users were affected? What was the reach of the bad output?
- What is the category of harm: factually wrong, biased, legally problematic, reputationally damaging?
- Do affected users need to be notified directly?
Step 3: Respond (8–48 hours)
- If public-facing: prepare an external communication. Do not equivocate. "Our AI feature produced an incorrect and inappropriate output. We have taken immediate steps to prevent recurrence and are investigating the root cause" is better than silence.
- Do not promise "this will never happen again." Promise that you take quality seriously, have investigated the root cause, and have implemented specific remediations.
Step 4: Remediate and Learn (48 hours – 2 weeks)
- Root cause analysis: Why did this happen?
- Add the failure case to your evaluation suite.
- Update prompts, guardrails, or filtering as appropriate.
- Update your incident response playbook with learnings.
Step 5: Prevent recurrence (ongoing)
- Brief the team on the incident and prevention measures.
- For significant incidents, add a standing item to quality review cadence.
Dashboard Template for AI Product Metrics
Health (system availability)
- AI feature availability / uptime
- Error rate (failed AI calls as % of total)
- Timeout rate
- p50, p95, p99 latency
Quality (output quality)
- Rolling 7-day thumbs-up rate
- Correction rate (if applicable)
- Manual review queue depth
- Escalations in last 24 hours
Cost (economics)
- Total AI cost today / this week / this month
- Cost per MAU (current month vs. prior month)
- Cost trend vs. forecast
Engagement (user behavior)
- Daily active users of AI feature
- Feature adoption rate
- Opt-out rate (if applicable)
- AI-influenced task completion rate
Every AI feature you ship should have a monitoring plan finalized before the feature goes to canary. Monitoring is a launch requirement, not a cleanup task.
From 100 Users to 100,000: What Breaks
Prompt Length Creep
At 100 users in a controlled beta, your average prompt is 1,200 tokens. At 100,000 users using the product in unpredictable ways, your average prompt might be 3,800 tokens — not because of any change you made, but because real users attach longer documents, ask more complex questions, have more context injected due to account history, and your prompt templates have been extended over time to handle edge cases.
A 3x growth in average prompt length means a 3x growth in input token cost — before accounting for user volume growth.
Prevention: Monitor average input token count as a standing production metric. Set an alert if it increases by more than 20% over a rolling 30-day period.
Rate Limit Encounters
Your model provider has rate limits — caps on how many tokens per minute or requests per day you can make. In your 100-user beta, you never came close. At 100,000 users, during peak hours, you hit them.
Prevention: Know your rate limits before you scale. Request limit increases from your model provider as part of your growth planning. Design your application to handle rate limit errors gracefully — show users a meaningful message and queue requests for near-term retry.
Tail User Cost Concentration
At 100,000 users, you will inevitably have a small number who are generating a disproportionate share of your AI costs. These include power users who have built automated workflows, developers using your API in a loop, enterprise accounts with large teams, or bots that have discovered your AI feature.
Prevention: Instrument cost by user at the P90, P95, and P99 percentile level. Know who your top-cost users are and what they are doing. Introduce soft limits that flag for review and hard limits that cap usage.
Evaluation Infrastructure at Scale
Your evaluation suite runs in minutes at 100 users. At 100,000 users, your production distribution has expanded dramatically, your evaluation suite may no longer be representative, and comprehensive evaluations may now take hours.
Prevention: Invest in evaluation infrastructure that scales. Identify a statistically valid random sample of production queries for your evaluation set, update it regularly, and design evaluation runs to be efficient.
Cost Scaling: Linear Usage Does Not Equal Linear Cost
If you have 100 users and you grow to 1,000 users (10x), your AI costs will typically grow more than 10x:
New user behavior divergence: Subsequent users are more diverse, often triggering more costly edge cases.
Feature expansion: As you scale, you typically add AI capabilities, growing average cost per call.
Support and safety overhead: Monitoring, logging, moderation, and safety infrastructure adds cost per call.
A reasonable planning assumption: AI costs will scale at 1.2–1.5x the rate of user growth until you have optimization and caching infrastructure in place.
Cost scaling model:
| Users | Naive estimate (1:1 scaling) | Realistic estimate (1.3x multiplier) | With optimizations |
|---|---|---|---|
| 1,000 | 10x baseline | 13x baseline | 10–11x baseline |
| 10,000 | 100x baseline | 130x baseline | 80–90x baseline |
| 100,000 | 1,000x baseline | 1,300x baseline | 600–800x baseline |
Rate Limiting and Fair Use Policies
Rate limits and fair use policies serve two purposes: protecting your economics and protecting service quality for all users.
Designing Rate Limits
The user value test: What volume of AI feature usage would a highly engaged but non-abusive user reasonably want in a month? Set your soft limit at approximately 2x that number. Set your hard limit at 5x.
| User type | Typical usage | Soft limit | Hard limit |
|---|---|---|---|
| Occasional user | 5–10 AI calls/month | 50/month | 200/month |
| Regular user | 50–100 AI calls/month | 250/month | 1,000/month |
| Power user | 500–1,000 AI calls/month | 2,000/month | 10,000/month |
Communicating Fair Use Policies
- Display current usage and limit prominently in the product — not buried in settings.
- Send a notification when a user reaches 80% of their limit, not when they hit 100%.
- When a user hits their limit, explain clearly: what the limit is, why it exists, and how they can get more.
- Never let a limit feel punitive.
Caching Strategies That Save Money (and When They Backfire)
Exact Match Caching
Store AI outputs and retrieve them by exact input hash. If the exact same prompt appears again, return the cached result without calling the model.
Best for: Autocomplete, search suggestions, FAQ-style lookups.
Limitations: Cache hit rate depends on how often users ask identical questions. Start here before investing in more complex strategies.
Semantic Caching
Store AI outputs and retrieve them when a semantically similar input arrives — matching by vector similarity rather than exact text.
Best for: FAQ systems, knowledge base Q&A, customer support chatbots where many users ask about the same topics differently.
The backfire scenario: A user asks a subtly different question that gets matched to a cached response for a similar but different question. Semantic caching requires careful threshold tuning and periodic auditing.
When Caching Backfires
| Scenario | What goes wrong | Prevention |
|---|---|---|
| Stale cached responses | Cached answers become wrong as the world changes | Set TTL on cache entries; shorter for fast-changing domains |
| Cache poisoning from bad outputs | An early bad AI output gets cached and served to many users | Review cached responses periodically; allow cache invalidation |
| Semantic cache false matches | Similar-but-wrong answers returned due to aggressive similarity threshold | Tune similarity threshold conservatively; monitor cache hit quality |
| Cache serving wrong user context | Cached responses don't account for user-specific context | Never cache outputs personalized to user-specific data |
The general rule: Cache is safest for factual, relatively stable, non-personalized content.
International Expansion: AI Features Across Languages and Regulations
International expansion of AI features is substantially more complex than international expansion of traditional software.
Linguistic Complexity
Token length variation: Different languages tokenize very differently. Japanese, Chinese, and Korean can result in significantly more tokens per sentence than English — sometimes 2–3x the cost per call. Audit token costs per language before launching internationally.
Quality variation by language: Frontier AI models are predominantly trained on English data. Quality for Spanish, French, German, and other high-resource languages is typically strong. Quality for lower-resource languages can be significantly worse. Run language-specific quality evaluations before launching in a new language.
Cultural and contextual differences: AI features that understand user intent depend on cultural context that varies significantly across markets.
Regulatory Variation
Data residency requirements: Several jurisdictions require that data about their citizens be processed and stored within their borders. Audit data residency requirements before expanding AI features to new markets.
AI-specific regulations: The EU AI Act and similar regulations impose requirements on AI systems — transparency obligations, human oversight requirements, conformity assessments.
Content regulation: AI-generated content may face different legal treatment in different jurisdictions.
Regulatory Readiness Checklist for International AI Expansion
| Question | Notes |
|---|---|
| Does the target market require data residency for personal data? | May affect model provider selection |
| Does the target market classify this AI feature as high-risk? | May trigger compliance requirements |
| Do users need to be notified that they're interacting with AI? | Transparency obligations vary |
| Does the feature generate content subject to local content laws? | Varies significantly by jurisdiction |
| What are the data deletion and rectification requirements? | AI features that memorize user data face unique challenges |
The Scaling Readiness Checklist
Before your AI feature enters a high-growth phase:
Cost and economics
- You have a cost model that forecasts AI spend under 3 usage scenarios (conservative, expected, aggressive)
- You have defined cost thresholds that trigger pricing or architecture reviews
- You have identified your P99 cost users and have a plan to manage them
Infrastructure
- You have confirmed your rate limits with your model provider and have a process to request increases
- You have designed graceful degradation for rate limit scenarios
- You have implemented or evaluated caching for your highest-volume query types
Fair use
- You have defined usage limits for each pricing tier
- Users can see their current usage and limits in-product
- You have a documented plan for what happens when users hit limits
International
- You have evaluated token cost differences for target languages
- You have run quality evaluations in target languages
- You have completed a regulatory review for each target market
Summary
Operating AI at scale requires two parallel disciplines. The first is quality monitoring, tracking not just whether the feature is available, but whether its outputs remain useful. The four monitoring dimensions (quality, cost, latency, user satisfaction) give you the signals you need. Feedback loops turn those signals into improvement. Drift detection keeps you ahead of gradual degradation. Incident response playbooks ensure you are ready when something goes wrong publicly.
The second discipline is cost and scale management. AI costs do not scale linearly with users. They scale faster, with breakpoints that surprise teams who planned on traditional infrastructure assumptions. Prompt length creep, rate limit encounters, and tail user cost concentration are the most common scaling surprises. Rate limits, fair use policies, and caching strategies manage costs without degrading the experience for typical users.
International expansion compounds both challenges: linguistic complexity affects quality and cost, while regulatory variation introduces compliance requirements that traditional software localization does not face.
Scaling is not a problem that only affects successful products. It is a problem that determines whether successful products remain sustainable, or whether their success becomes the source of their failure.