Chapter 13 of 20
Observability
Tuesday, 2:47 AM. A loan-approval agent in production has been silently rejecting every application for the past six hours. No errors in the logs. No alerts firing. The HTTP status codes are all 200. Each applicant receives a polite decline email with a coherent, well-structured explanation that cit
Part 4: Production
Observability
Tuesday, 2:47 AM. A loan-approval agent in production has been silently rejecting every application for the past six hours. No errors in the logs. No alerts firing. The HTTP status codes are all 200. Each applicant receives a polite decline email with a coherent, well-structured explanation that cites the bank’s lending criteria. The problem: the agent’s retrieval step started returning an outdated policy document after a vector store reindex, and the model dutifully followed it. Six hours, four hundred rejected applications, zero exceptions. You discover it at 8 AM when the lending team notices the approval rate dropped to zero. This is not a crash. It is a silent behavioral drift that only observability can catch.
What You Will Learn
- Why traditional monitoring fails for agent systems and what observability must cover instead
- How to instrument agent runs with distributed traces, spans, and structured logs using OpenTelemetry
- Which metrics matter for production agents: latency, token usage, error rates, and behavioral signals
- How to build dashboards that surface agent health, cost, and quality at a glance
- How to debug non-deterministic agent behavior by replaying traces and inspecting decision points
- How to integrate LLM observability platforms like LangSmith and Langfuse into your stack
13.1 Why Agents Need Observability
Traditional web services have a simple contract: a request arrives, the server processes it, a response leaves. If the server throws an exception, the error propagates. If latency spikes, the load balancer notices. Monitoring tools built for this world assume that failures are loud and deterministic.
Agents break every one of those assumptions. A single user request triggers a chain of LLM calls, tool invocations, retrieval steps, and reasoning loops. Each step is non-deterministic. The agent might take three steps today and seven tomorrow for an identical query. And when it fails, it usually does so silently, returning a plausible-sounding answer that happens to be wrong.
Non-determinism. The same input produces different traces every time. You must observe the distribution of behaviors, not a single expected path.
Multi-step opacity. A single agent run might involve five LLM calls, three tool invocations, and two retrieval queries. Traditional request/response monitoring sees one HTTP call. Everything inside is a black box unless you instrument it.
Silent failure modes. An agent that retrieves outdated documents or hallucinates a tool argument does not throw an exception. It returns a 200 status code with a confidently wrong answer. The only way to catch these failures is to observe what the agent did at every step.
Monitoring vs. Observability
Monitoring tells you that something went wrong. Observability tells you why. Monitoring watches predefined metrics and fires alerts when thresholds are breached. Observability captures enough context, traces, logs, and metrics, that you can debug novel failures you did not anticipate. For agents, you cannot predefine what “wrong” looks like. You need the raw telemetry to investigate.
13.2 Traces and Spans
A trace represents one complete agent run from initial request to final response. A trace is composed of spans, which are individual units of work. Each span captures an operation: an LLM call, a tool invocation, or a retrieval query. Spans nest hierarchically: the root span covers the entire run, child spans cover individual steps, and grandchild spans cover sub-operations like the HTTP request inside a web-search tool.
from opentelemetry import trace
from opentelemetry.sdk.trace import TracerProvider
from opentelemetry.sdk.trace.export import BatchSpanProcessor
from opentelemetry.exporter.otlp.proto.grpc.trace_exporter import OTLPSpanExporter
from opentelemetry.sdk.resources import Resource

def configure_tracing(service_name: str = "agent-service") -> trace.Tracer:
    """Configure OpenTelemetry tracing for an agent service."""
    resource = Resource.create({"service.name": service_name})
    provider = TracerProvider(resource=resource)
    exporter = OTLPSpanExporter(endpoint="http://localhost:4317", insecure=True)
    provider.add_span_processor(BatchSpanProcessor(exporter))
    trace.set_tracer_provider(provider)
    return trace.get_tracer(service_name)
The critical design decision is what becomes a span. For agents, create spans for every LLM call (with prompt and completion as attributes), every tool invocation (with arguments and return values), every retrieval query (with query text and result count), and every reasoning step. A reusable decorator makes this practical:
import functools

tracer = trace.get_tracer("agent-service")

def traced(span_name: str = None, capture_args: bool = True):
    """Decorator that wraps a function in an OpenTelemetry span."""
    def decorator(func):
        @functools.wraps(func)
        def wrapper(*args, **kwargs):
            name = span_name or f"{func.__module__}.{func.__qualname__}"
            with tracer.start_as_current_span(name) as span:
                if capture_args:
                    for key, val in kwargs.items():
                        span.set_attribute(f"kwarg.{key}", str(val)[:500])
                try:
                    result = func(*args, **kwargs)
                    span.set_attribute("result.preview", str(result)[:500])
                    span.set_status(trace.StatusCode.OK)
                    return result
                except Exception as exc:
                    span.set_status(trace.StatusCode.ERROR, str(exc))
                    span.record_exception(exc)
                    raise
        return wrapper
    return decorator
13.3 Structured Logging
Unstructured log lines like print("Processing query...") are worthless for debugging agents at scale. Structured logs are JSON objects with consistent fields that can be queried, filtered, and correlated with traces.
import logging, json
from datetime import datetime, timezone

class StructuredAgentLogger:
    """Logger that emits JSON lines correlated with OpenTelemetry traces."""

    def __init__(self, service: str = "agent-service"):
        self.service = service
        self.logger = logging.getLogger(service)

    def log_event(self, event_type: str, data: dict, level: str = "info"):
        """Emit a structured log event with automatic trace correlation."""
        span = trace.get_current_span()
        ctx = span.get_span_context()
        record = {
            "timestamp": datetime.now(timezone.utc).isoformat(),
            "service": self.service,
            "event_type": event_type,
            "trace_id": format(ctx.trace_id, "032x") if ctx.trace_id else None,
            "level": level,
            **data,
        }
        getattr(self.logger, level)(json.dumps(record))

    def log_llm_call(self, model: str, prompt_tokens: int,
                     completion_tokens: int, latency_ms: float):
        self.log_event("llm_call", {
            "model": model, "prompt_tokens": prompt_tokens,
            "completion_tokens": completion_tokens,
            "total_tokens": prompt_tokens + completion_tokens,
            "latency_ms": round(latency_ms, 1),
        })

    def log_tool_call(self, tool_name: str, arguments: dict,
                      result_preview: str, latency_ms: float, success: bool = True):
        self.log_event("tool_call", {
            "tool_name": tool_name, "arguments": arguments,
            "result_preview": result_preview[:200],
            "latency_ms": round(latency_ms, 1), "success": success,
        })
The key field is trace_id. Every log event during an agent run carries the same trace ID, so you can pull every log line for a single run with one query. This bridges your logs and traces. Without it, structured logs are just well-formatted noise.
13.4 Metrics That Matter
While traces tell the story of a single run, metrics tell the story of your system. For agents, the metrics that matter fall into four categories:
| Category | Metric | Why It Matters |
|---|---|---|
| Latency | End-to-end run duration (p50, p95, p99) | Users abandon slow agents; spikes signal reasoning loops |
| Cost | Tokens consumed per run (prompt + completion) | A runaway agent can burn through your budget in minutes |
| Error | LLM error rate (rate limits, timeouts, malformed output) | Provider issues propagate silently through agent chains |
| Error | Tool failure rate per tool | A broken tool degrades every agent that depends on it |
| Quality | Retrieval hit rate (queries with zero relevant results) | Zero-hit retrievals force the agent to hallucinate or fail |
| Quality | User feedback rate (thumbs up/down) | The most direct signal of whether the agent is helping |
from opentelemetry import metrics
from opentelemetry.sdk.metrics import MeterProvider
from opentelemetry.sdk.metrics.export import PeriodicExportingMetricReader
from opentelemetry.exporter.otlp.proto.grpc.metric_exporter import OTLPMetricExporter

exporter = OTLPMetricExporter(endpoint="http://localhost:4317", insecure=True)
reader = PeriodicExportingMetricReader(exporter, export_interval_millis=10000)
provider = MeterProvider(metric_readers=[reader])
metrics.set_meter_provider(provider)
meter = metrics.get_meter("agent-service")

run_duration  = meter.create_histogram("agent.run.duration_ms", unit="ms")
token_counter = meter.create_counter("agent.tokens.total", unit="tokens")
tool_calls    = meter.create_counter("agent.tool_calls.total")
error_counter = meter.create_counter("agent.errors.total")
step_counter  = meter.create_histogram("agent.run.steps")
Cost Tracking Is Not Optional
An agent in a reasoning loop can make dozens of LLM calls before a timeout kills it. At $10–$30 per million input tokens for frontier models, a single runaway run can cost more than your daily budget. Track tokens per run with hard limits, and alert when any run exceeds your p99 token count by more than 2x.
13.5 Instrumenting an Agent
The following class wraps an agent execution loop with full observability: traces for each step, structured logs for each event, and metrics for aggregate monitoring.
import time

class ObservableAgent:
    """Agent wrapper that emits traces, logs, and metrics for every run."""

    def __init__(self, agent, model: str = "gpt-4o"):
        self.agent = agent
        self.model = model
        self.logger = StructuredAgentLogger()

    def run(self, user_input: str, session_id: str = None) -> dict:
        with tracer.start_as_current_span("agent.run") as root_span:
            root_span.set_attribute("user.input", user_input[:1000])
            start, total_tokens, steps = time.perf_counter(), 0, 0
            messages = [{"role": "user", "content": user_input}]

            try:
                while steps < 15:  # hard cap prevents infinite loops
                    steps += 1

                    with tracer.start_as_current_span("llm.call") as llm_span:
                        t0 = time.perf_counter()
                        response = self._call_llm(messages)
                        ms = (time.perf_counter() - t0) * 1000
                        usage = response["usage"]
                        llm_span.set_attribute("llm.model", self.model)
                        llm_span.set_attribute("llm.tokens", usage["total_tokens"])
                        total_tokens += usage["total_tokens"]
                        token_counter.add(usage["total_tokens"], {"model": self.model})
                        self.logger.log_llm_call(self.model, usage["prompt_tokens"],
                                                 usage["completion_tokens"], ms)

                    assistant_msg = response["choices"][0]["message"]
                    messages.append(assistant_msg)
                    if not assistant_msg.get("tool_calls"):
                        break

                    for tc in assistant_msg["tool_calls"]:
                        with tracer.start_as_current_span("tool.call") as ts:
                            name = tc["function"]["name"]
                            ts.set_attribute("tool.name", name)
                            t0 = time.perf_counter()
                            result = self._execute_tool(name, tc["function"]["arguments"])
                            tool_ms = (time.perf_counter() - t0) * 1000
                            tool_calls.add(1, {"tool": name})
                            self.logger.log_tool_call(name, {}, str(result), tool_ms)
                            messages.append({"role": "tool", "tool_call_id": tc["id"],
                                             "content": str(result)})

                duration_ms = (time.perf_counter() - start) * 1000
                run_duration.record(duration_ms)
                step_counter.record(steps)
                root_span.set_attribute("agent.steps", steps)
                return {"output": messages[-1].get("content", ""),
                        "steps": steps, "total_tokens": total_tokens,
                        "duration_ms": round(duration_ms, 1)}
            except Exception as exc:
                error_counter.add(1, {"error_type": type(exc).__name__})
                root_span.set_status(trace.StatusCode.ERROR, str(exc))
                root_span.record_exception(exc)
                raise
Three design decisions matter here. The step cap prevents runaway loops. Every span captures both inputs and outputs: you cannot debug an agent if you only know a tool was called but not what it returned. Metrics are recorded inline with the trace, ensuring they always agree.
13.6 The Observability Stack
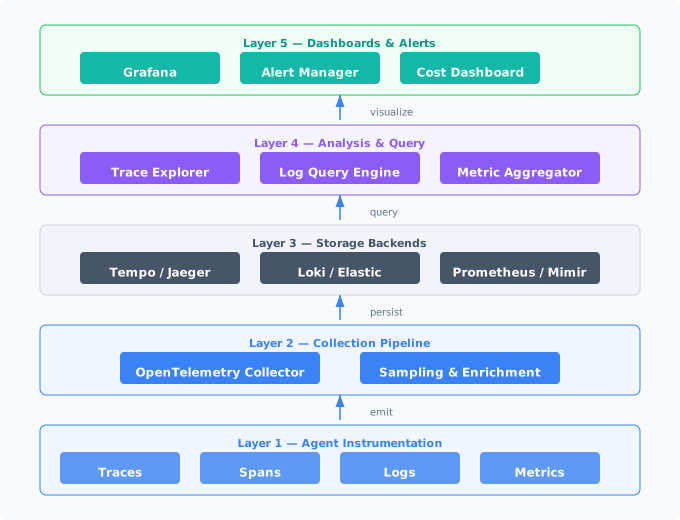
Figure 13-1. The five-layer observability stack for agent systems. Telemetry flows upward from instrumentation through collection, storage, and analysis to dashboards.
Layer 1: Instrumentation. Your agent code emits raw telemetry using the OpenTelemetry SDK: the @traced decorators, the structured logger calls, the metric counters.
Layer 2: Collection. The OpenTelemetry Collector receives telemetry, batches it, applies sampling rules, and enriches it with metadata like environment labels and service version tags.
Layer 3: Storage. Each signal type goes to a specialized backend. Traces to Tempo or Jaeger, logs to Loki or Elasticsearch, metrics to Prometheus or Mimir. Specialized storage matters because access patterns differ: traces are queried by ID, logs by time range and filter, metrics by aggregation window.
Layer 4: Analysis. Query engines let you explore stored telemetry: trace waterfalls, log search, metric aggregation, and anomaly detection.
Layer 5: Dashboards and Alerts. Grafana turns raw data into visual panels. Alert rules fire when metrics cross thresholds: latency exceeding 2x p99, error rate above 5%, token usage per run exceeding budget.
13.7 Debugging Agent Behavior
The hardest part of agent observability is knowing what to look for. Agent failures rarely look like traditional bugs. They look like behavioral shifts: the agent used to answer in three steps and now takes nine, or it started calling a tool with slightly different arguments that produce subtly wrong results.
Trace Replay
The most powerful debugging technique is trace replay: pulling the complete trace for a problematic run and walking through every decision. For each span, examine: what was the input? What did the model output? What tool was called, with what arguments? Where did reasoning diverge from the expected path?
class TraceDebugger:
    """Utility for replaying and analyzing agent traces."""

    def __init__(self, backend_url: str):
        self.backend_url = backend_url

    def summarize_run(self, trace_id: str) -> str:
        """Print a human-readable summary of an agent run."""
        import requests
        data = requests.get(f"{self.backend_url}/api/traces/{trace_id}").json()
        spans = sorted(data["spans"], key=lambda s: s["startTimeUnixNano"])
        lines = []
        for span in spans:
            indent = "  " * span.get("depth", 0)
            ms = (span["endTimeUnixNano"] - span["startTimeUnixNano"]) / 1e6
            attrs = {a["key"]: a["value"] for a in span.get("attributes", [])}
            line = f"{indent}{span['name']} ({ms:.0f}ms)"
            if "llm.model" in attrs:
                line += f" | model={attrs['llm.model']} tokens={attrs.get('llm.tokens','?')}"
            elif "tool.name" in attrs:
                line += f" | tool={attrs['tool.name']}"
            lines.append(line)
        return "\n".join(lines)

    def find_anomalies(self, trace_id: str) -> list[str]:
        """Flag potential issues in a trace."""
        import requests
        spans = requests.get(f"{self.backend_url}/api/traces/{trace_id}").json()["spans"]
        issues = []
        llm_calls = [s for s in spans if s["name"] == "llm.call"]
        if len(llm_calls) > 8:
            issues.append(f"Excessive LLM calls: {len(llm_calls)}")
        # Detect duplicate tool calls with identical arguments
        seen = set()
        for s in spans:
            if s["name"] != "tool.call": continue
            attrs = {a["key"]: a["value"] for a in s.get("attributes", [])}
            key = (attrs.get("tool.name"), attrs.get("tool.arguments"))
            if key in seen:
                issues.append(f"Duplicate tool call: {attrs.get('tool.name')}")
            seen.add(key)
        return issues
Behavioral Baselines
To detect drift, you need to know what normal looks like. Establish baselines from known-good runs: average step count, median latency, typical token usage distribution. Then alert when new runs deviate beyond a configurable threshold.
import statistics

class BehavioralBaseline:
    """Track and compare agent behavior against established baselines."""

    def __init__(self):
        self.baselines = {}

    def record_baseline(self, query_type: str, runs: list[dict]):
        """Establish a baseline from known-good runs."""
        self.baselines[query_type] = {
            "steps_p95": sorted(r["steps"] for r in runs)[int(len(runs) * 0.95)],
            "tokens_median": statistics.median(r["total_tokens"] for r in runs),
            "latency_p95": sorted(r["duration_ms"] for r in runs)[int(len(runs) * 0.95)],
        }

    def check_run(self, query_type: str, run: dict) -> list[str]:
        """Check a run against baseline, return warnings."""
        b = self.baselines.get(query_type)
        if not b: return []
        warnings = []
        if run["steps"] > b["steps_p95"] * 1.5:
            warnings.append(f"Steps {run['steps']} exceeds 1.5x p95 ({b['steps_p95']})")
        if run["total_tokens"] > b["tokens_median"] * 3:
            warnings.append(f"Tokens {run['total_tokens']} exceeds 3x median ({b['tokens_median']})")
        if run["duration_ms"] > b["latency_p95"] * 2:
            warnings.append(f"Latency {run['duration_ms']:.0f}ms exceeds 2x p95 ({b['latency_p95']:.0f}ms)")
        return warnings
The Hardest Bug: Correct Format, Wrong Content
The most insidious agent failures produce output that is syntactically perfect but semantically wrong. The JSON is valid, the tone is professional, the citations are formatted correctly, but the answer is factually incorrect. These bugs are invisible to traditional monitoring. The only defense is logging the full reasoning chain and periodically sampling runs for human review.
13.8 Building Dashboards
A good agent dashboard answers three questions at a glance: Is the agent working? (error rates, completion rates). Is it fast enough? (latency percentiles). Is it affordable? (token usage, cost per run).
Run Success Rate (time series). Percentage of runs completing without errors. A sudden drop signals a systemic issue. A gradual decline signals drift. Target: above 98%.
Latency Distribution (heatmap). Plot p50, p95, and p99 on the same chart. If p99 is 10x p50, some runs are hitting a pathological path, usually a reasoning loop.
Token Usage per Run (histogram). The distribution should be roughly normal for a given query type. A fat right tail means some runs are consuming far more tokens than expected. Investigate those by pulling their traces.
Step Count Distribution (histogram). An increase in median step count often precedes an increase in error rate. The agent is struggling more before it fails.
Tool Call Breakdown (stacked bar). If a tool that should be called in 5% of runs suddenly appears in 40%, the agent’s planning has changed. This is an early warning sign.
# Prometheus alerting rules for agent observability
ALERTING_RULES = """
groups:
  - name: agent_alerts
    rules:
      - alert: AgentHighErrorRate
        expr: >
          rate(agent_errors_total[5m])
          / rate(agent_run_duration_ms_count[5m]) > 0.05
        for: 3m
        labels: { severity: critical }
        annotations: { summary: "Agent error rate above 5%" }

      - alert: AgentLatencyDegraded
        expr: >
          histogram_quantile(0.95, rate(agent_run_duration_ms_bucket[5m]))
          > 2 * histogram_quantile(0.95, rate(agent_run_duration_ms_bucket[7d]))
        for: 10m
        labels: { severity: warning }
        annotations: { summary: "p95 latency 2x above 7-day baseline" }

      - alert: AgentTokenBudgetBreach
        expr: >
          sum(rate(agent_tokens_total[1h])) * 3600
          > 1.5 * agent_hourly_token_budget
        for: 5m
        labels: { severity: critical }
        annotations: { summary: "Hourly tokens exceed 150% of budget" }
"""
13.9 LangSmith and Langfuse Integration
General-purpose tools (Grafana, Jaeger, Prometheus) give you the infrastructure layer. Purpose-built LLM observability platforms provide the application layer. They understand chains, tool calls, and retrieval steps, and provide specialized views for debugging agent behavior.
LangSmith
LangSmith is LangChain’s observability platform. Even without LangChain, you can use its tracing SDK:
from langsmith import traceable

# Requires: LANGCHAIN_TRACING_V2=true, LANGCHAIN_API_KEY, LANGCHAIN_PROJECT

@traceable(name="agent-run", run_type="chain")
def run_agent(user_input: str) -> str:
    plan = plan_steps(user_input)
    results = [execute_step(s) for s in plan]
    return synthesize_response(results)

@traceable(name="plan-steps", run_type="llm")
def plan_steps(user_input: str) -> list[str]:
    import openai
    client = openai.OpenAI()
    resp = client.chat.completions.create(
        model="gpt-4o",
        messages=[{"role": "system", "content": "Break this query into steps."},
                  {"role": "user", "content": user_input}],
    )
    return resp.choices[0].message.content.split("\n")

@traceable(name="execute-step", run_type="tool")
def execute_step(step: str) -> str:
    return f"Result for: {step}"  # your tool logic here
Langfuse
Langfuse is an open-source alternative you can self-host. It provides trace visualization, user feedback collection, prompt management, and cost analytics:
from langfuse.decorators import observe, langfuse_context

@observe(as_type="generation")
def call_llm(messages: list[dict], model: str = "gpt-4o") -> str:
    import openai
    response = openai.OpenAI().chat.completions.create(model=model, messages=messages)
    langfuse_context.update_current_observation(
        model=model,
        usage={"input": response.usage.prompt_tokens,
               "output": response.usage.completion_tokens},
    )
    return response.choices[0].message.content

@observe()
def agent_run(user_input: str) -> str:
    langfuse_context.update_current_trace(
        user_id="user-123", metadata={"source": "web-app"},
    )
    context = retrieve_context(user_input)
    response = call_llm([
        {"role": "system", "content": f"Context: {context}"},
        {"role": "user", "content": user_input},
    ])
    langfuse_context.update_current_trace(output=response, tags=["production"])
    return response
Choosing Between Platforms
Use LangSmith if you are already in the LangChain ecosystem. Use Langfuse if you need self-hosting or open-source flexibility. Use both with OpenTelemetry as the common transport layer: instrument once, export to whichever backend you prefer. You can switch platforms without changing your instrumentation code.
13.10 Common Failure Patterns
After operating agents in production, certain failure patterns recur. Recognizing them by their telemetry signature lets you diagnose issues faster.
The Infinite Loop. Step count hits the hard cap, token usage is 5–10x normal, and the last several LLM calls produce near-identical outputs. The agent is stuck in a cycle. Fix: add loop detection that compares consecutive outputs and breaks when similarity exceeds a threshold.
The Retrieval Miss. Retrieval spans return zero results or very low similarity scores, but the agent proceeds to answer anyway, hallucinating confidently. Fix: log retrieval scores and configure the agent to decline when retrieval quality is below threshold.
The Tool Argument Drift. Tool calls start failing because the model passes slightly wrong arguments, such as a date in the wrong format or a renamed field. Fix: version your tool schemas, test tool calls in CI, and log argument validation failures.
The Context Window Overflow. Token counts spike for a subset of runs, and output quality drops. The agent accumulated too much context across steps or a retrieval step returned an unusually large document. Fix: track cumulative context size and implement summarization when it exceeds a threshold.
13.11 Distributed Tracing for Multi-Agent Systems
Single-agent tracing is straightforward: one root span, child spans for each step. Multi-agent systems break this model. A supervisor agent delegates to a researcher agent, which calls a retrieval agent, which fans out to three data source agents. The user's request spawns a tree of agent invocations across multiple processes, potentially across multiple machines. Without distributed tracing, you see five independent traces that have no visible relationship to each other.
The solution is trace context propagation: passing the trace ID and parent span ID from one agent to the next so that all work for a single user request appears in a single, unified trace.
Trace Propagation Across Agent Boundaries
When one agent invokes another, whether through a function call, a message queue, or an HTTP request, the calling agent must inject its current trace context into the request. The receiving agent extracts that context and creates a child span, establishing the parent-child relationship that makes the trace navigable.
from opentelemetry import trace, context
from opentelemetry.propagate import inject, extract
from opentelemetry.trace import SpanKind

tracer = trace.get_tracer("multi-agent-service")


def invoke_child_agent(agent_name: str, task: dict, headers: dict = None) -> dict:
    """Call a child agent with trace context propagation."""
    headers = headers or {}

    with tracer.start_as_current_span(
        f"agent.delegate.{agent_name}",
        kind=SpanKind.CLIENT,
    ) as span:
        span.set_attribute("agent.child.name", agent_name)
        span.set_attribute("agent.task.type", task.get("type", "unknown"))

        # Inject current trace context into headers for the child agent
        inject(headers)

        # Call the child agent (HTTP, message queue, or in-process)
        response = _send_to_agent(agent_name, task, headers)
        span.set_attribute("agent.child.status", response.get("status", "unknown"))
        return response


def handle_delegated_task(task: dict, headers: dict) -> dict:
    """Entry point for a child agent receiving a delegated task."""
    # Extract parent trace context from incoming headers
    parent_context = extract(headers)

    with tracer.start_as_current_span(
        "agent.execute",
        context=parent_context,
        kind=SpanKind.SERVER,
    ) as span:
        span.set_attribute("agent.role", task.get("agent_role", "worker"))
        span.set_attribute("agent.task.id", task.get("task_id", ""))

        # Agent does its work here — all child spans are nested correctly
        result = _process_task(task)
        return result
Span Hierarchy Design
A well-designed span hierarchy for multi-agent systems follows a consistent naming convention that makes traces readable at a glance. The recommended hierarchy is:
agent.run (root — the user request)
├── agent.plan (supervisor decomposes the task)
├── agent.delegate.researcher (supervisor calls researcher)
│   ├── agent.execute (researcher begins work)
│   │   ├── llm.call (researcher reasons about the task)
│   │   ├── tool.call.web_search (researcher searches the web)
│   │   ├── agent.delegate.retriever (researcher calls retriever)
│   │   │   ├── agent.execute (retriever begins work)
│   │   │   │   ├── tool.call.vector_search (retriever queries vector DB)
│   │   │   │   └── tool.call.rerank (retriever reranks results)
│   │   │   └── (retriever returns results)
│   │   └── llm.call (researcher synthesizes findings)
│   └── (researcher returns results)
├── agent.delegate.writer (supervisor calls writer)
│   ├── agent.execute (writer begins work)
│   │   ├── llm.call (writer drafts response)
│   │   └── llm.call (writer self-edits)
│   └── (writer returns draft)
└── agent.synthesize (supervisor assembles final response)
Each span at the agent.delegate.* level carries attributes identifying the child agent, the task description, and the delegation reason. Each agent.execute span carries the agent's role and configuration. This hierarchy means you can collapse the trace to see only agent-to-agent delegation, or expand it to inspect individual LLM calls and tool invocations within any agent.
Correlating Traces Across Asynchronous Boundaries
When agents communicate through message queues (Kafka, RabbitMQ, Redis Streams), the propagation pattern changes. You cannot rely on HTTP headers because there is no synchronous request/response cycle. Instead, embed the trace context in the message payload itself.
from opentelemetry.propagate import inject, extract

def publish_agent_task(queue: str, task: dict):
    """Publish a task to a message queue with trace context."""
    carrier = {}
    inject(carrier)  # Serialize current trace context
    message = {
        "task": task,
        "trace_context": carrier,  # Embed in the message
        "published_at": time.time(),
    }
    _publish_to_queue(queue, message)


def consume_agent_task(message: dict):
    """Consume a task from a message queue, restoring trace context."""
    carrier = message.get("trace_context", {})
    parent_context = extract(carrier)

    # Create a CONSUMER span linked to the original trace
    with tracer.start_as_current_span(
        "agent.consume",
        context=parent_context,
        kind=SpanKind.CONSUMER,
    ) as span:
        span.set_attribute("messaging.queue", message.get("queue", "unknown"))
        _process_task(message["task"])
Cross-Process Trace Stitching
In large multi-agent deployments, a single user request can generate spans across five or more processes. Without propagation, you have five orphan traces. With propagation, you have one unified trace that shows the full journey. The overhead of propagation is negligible, only a few hundred bytes of metadata per message, but the debugging value is transformational. Invest in propagation early; retrofitting it into an existing system is significantly harder.
13.12 Cost Tracking and Attribution
When a single user request fans out across multiple agents, each making its own LLM calls with different models, cost attribution becomes a critical observability capability. You need to know not just the total cost of a request, but which agent consumed what, which model was responsible, and whether any agent is disproportionately expensive relative to the value it provides.
Per-Agent Cost Breakdown
The following decorator captures cost data at the agent level, tagging every LLM call with the agent that made it. This allows you to aggregate costs by agent role, by model, and by request.
import functools
import time
from contextlib import contextmanager
from dataclasses import dataclass, field
from typing import Optional
import threading

# Thread-local storage for the current cost context
_cost_context = threading.local()

MODEL_COSTS_PER_MILLION = {
    "gpt-4o":              {"input": 2.50, "output": 10.00},
    "gpt-4o-mini":         {"input": 0.15, "output": 0.60},
    "claude-sonnet-4-20250514": {"input": 3.00, "output": 15.00},
    "claude-haiku-3-20250313":  {"input": 0.80, "output": 4.00},
}


@dataclass
class AgentCostRecord:
    agent_name: str
    model: str
    input_tokens: int
    output_tokens: int
    cost_usd: float
    timestamp: float
    request_id: str


@dataclass
class RequestCostContext:
    request_id: str
    records: list[AgentCostRecord] = field(default_factory=list)
    budget_usd: float = 1.00

    def record(self, agent_name: str, model: str,
               input_tokens: int, output_tokens: int):
        costs = MODEL_COSTS_PER_MILLION.get(model, {"input": 5.0, "output": 15.0})
        cost = (input_tokens * costs["input"]
                + output_tokens * costs["output"]) / 1_000_000
        self.records.append(AgentCostRecord(
            agent_name=agent_name, model=model,
            input_tokens=input_tokens, output_tokens=output_tokens,
            cost_usd=cost, timestamp=time.time(),
            request_id=self.request_id,
        ))

    @property
    def total_cost(self) -> float:
        return sum(r.cost_usd for r in self.records)

    def cost_by_agent(self) -> dict[str, float]:
        breakdown = {}
        for r in self.records:
            breakdown[r.agent_name] = breakdown.get(r.agent_name, 0) + r.cost_usd
        return breakdown

    def is_over_budget(self) -> bool:
        return self.total_cost >= self.budget_usd


@contextmanager
def cost_tracking_context(request_id: str, budget_usd: float = 1.00):
    """Context manager that tracks costs across all agents in a request."""
    ctx = RequestCostContext(request_id=request_id, budget_usd=budget_usd)
    _cost_context.current = ctx
    try:
        yield ctx
    finally:
        _cost_context.current = None


def track_cost(agent_name: str):
    """Decorator that records LLM call costs for the decorated function."""
    def decorator(func):
        @functools.wraps(func)
        def wrapper(*args, **kwargs):
            result = func(*args, **kwargs)

            # Extract usage from the response (OpenAI format)
            usage = getattr(result, "usage", None)
            if usage and hasattr(_cost_context, "current") and _cost_context.current:
                model = getattr(result, "model", "unknown")
                _cost_context.current.record(
                    agent_name=agent_name,
                    model=model,
                    input_tokens=usage.prompt_tokens,
                    output_tokens=usage.completion_tokens,
                )
                # Check budget and raise if exceeded
                if _cost_context.current.is_over_budget():
                    raise BudgetExceededError(
                        f"Request {_cost_context.current.request_id} exceeded "
                        f"budget: ${_cost_context.current.total_cost:.4f} "
                        f"> ${_cost_context.current.budget_usd:.2f}"
                    )
            return result
        return wrapper
    return decorator


class BudgetExceededError(Exception):
    pass
Usage in a Multi-Agent System
# Each agent's LLM call function is decorated with its agent name
@track_cost("researcher")
def researcher_llm_call(messages):
    return openai.chat.completions.create(model="gpt-4o", messages=messages)


@track_cost("writer")
def writer_llm_call(messages):
    return openai.chat.completions.create(model="gpt-4o-mini", messages=messages)


# The supervisor wraps the entire request in a cost context
def handle_request(user_input: str, request_id: str):
    with cost_tracking_context(request_id, budget_usd=0.50) as ctx:
        try:
            research = researcher_llm_call([...])
            draft = writer_llm_call([...])
            return {"output": draft, "cost": ctx.cost_by_agent()}
        except BudgetExceededError:
            return {"output": "Partial result (budget limit reached)",
                    "cost": ctx.cost_by_agent()}
Budget Alerts and Token Tracking
Beyond per-request budgets, production systems need aggregate cost monitoring. Track three levels of budget alerts:
Hourly burn rate. If the current hour's spending exceeds 2x the average hourly spend from the past 7 days, fire a warning. This catches sudden traffic spikes or misbehaving agents before they accumulate into large bills.
Daily budget threshold. Alert at 70% of the daily budget so the on-call engineer has time to investigate. At 90%, automatically downgrade non-critical agents to cheaper models. At 100%, reject new requests with a graceful error message and page the team.
Per-agent anomaly detection. If a specific agent's cost share changes dramatically, say the researcher agent normally accounts for 40% of total cost but suddenly jumps to 80%, that agent may be stuck in a reasoning loop or receiving unusually complex inputs. Alert on per-agent cost share deviations of more than 2x from the 7-day baseline.
13.13 Production Monitoring Checklist
The following table consolidates the metrics every production agent system should track. Use it as a checklist when setting up your monitoring stack. If any row is missing from your dashboards, you have a blind spot.
| Category | Metric | How to Measure | Alert Threshold | Why It Matters |
|---|---|---|---|---|
| Latency | End-to-end p50 | Histogram of total run duration | Baseline-dependent | Median user experience |
| Latency | End-to-end p95 | Histogram of total run duration | >2x 7-day p95 | Tail latency affecting 1-in-20 users |
| Latency | End-to-end p99 | Histogram of total run duration | >3x 7-day p99 | Worst-case user experience; often signals loops |
| Latency | Per-LLM-call latency | Timer around each LLM API call | >5s for p95 | Provider degradation detection |
| Tokens | Input tokens per run | Sum of prompt tokens across all calls | >3x median | Context bloat or retrieval returning too much |
| Tokens | Output tokens per run | Sum of completion tokens across all calls | >3x median | Model verbosity drift or reasoning loops |
| Tokens | Cumulative context size | Max context window usage in any single call | >80% of window | Risk of truncation and lost instructions |
| Cost | Cost per run (USD) | Token counts multiplied by model pricing | >per-request budget | Runaway spend on individual requests |
| Cost | Hourly burn rate | Aggregated cost across all runs per hour | >2x 7-day average | Traffic spikes or systemic cost increases |
| Cost | Per-agent cost share | Cost attributed to each agent role | >2x baseline share | Single agent dominating spend |
| Errors | LLM error rate | Count of 4xx/5xx from LLM providers | >5% over 5 min | Provider outage or rate limiting |
| Errors | Tool call failure rate | Failed tool calls / total tool calls | >10% per tool | Broken integration or schema drift |
| Errors | Parse failure rate | Responses that fail structured output parsing | >5% over 5 min | Model output format regression |
| Agent | Agent loop count | Number of LLM calls per run | p95 >2x baseline | Reasoning loops or planning regression |
| Agent | Tool call distribution | Frequency of each tool per time window | Deviation from baseline | Shift in agent behavior or planning strategy |
| Agent | Fallback trigger rate | Count of fallback activations / total runs | >10% over 5 min | Primary model degradation |
| Quality | Retrieval hit rate | Runs with at least one relevant retrieval result | <90% | Vector store issues or query drift |
| Quality | User feedback score | Thumbs up/down or explicit rating | <80% positive | Output quality degradation |
| Quality | Hallucination rate | Automated fact-checking against source docs | >5% of sampled runs | Model grounding failures |
Prioritize Incrementally
You do not need every metric on day one. Start with the top four: end-to-end p95 latency, LLM error rate, cost per run, and agent loop count. These four metrics catch the most common production issues: slow responses, provider outages, budget breaches, and reasoning loops. Add quality metrics in week two, and per-agent cost attribution once you have multi-agent workflows.
Project: Agent Observatory
Build a complete observability layer for an agent system. Instrument an existing agent (or the one from Chapter 4) with OpenTelemetry traces, structured logs, and metrics. Create a dashboard that shows run success rate, latency percentiles, token usage, and step count distribution. Implement at least two alert rules. Test by introducing a deliberate failure (e.g., break a tool, inject a slow response) and verify your observability stack detects it.
DevOps Monitor Tech / Software
Clinical Trial Tracker Healthcare
Transaction Auditor Finance
Tutoring Quality Monitor Education
Order Fulfillment Observer E-commerce
Contract Review Auditor Legal
Summary
Agent observability is the difference between operating a production system and operating a production liability. Unlike traditional services, agents fail silently, behave non-deterministically, and drift in ways no predefined alert can anticipate. The only defense is capturing enough telemetry that you can reconstruct what any agent did, why it did it, and whether the result was correct.
- Agents fail silently. A 200 status code with a confidently wrong answer is the default failure mode. Observability must capture what the agent did at every step, not just whether it completed.
- Instrument every LLM call, tool invocation, and retrieval query as a separate span within a trace. Without span-level visibility, you are debugging with a blindfold.
- Track four metric categories: latency, cost, errors, and quality. Cost tracking is not optional. A single runaway loop can exceed your daily budget.
- Establish behavioral baselines from known-good runs and alert on deviations. Step count increases and token usage spikes are leading indicators of quality degradation.
- Use OpenTelemetry for vendor-neutral instrumentation and export to your platform of choice. You can switch backends without rewriting instrumentation code.
Exercises
| Type | Exercise | Description |
|---|---|---|
| Conceptual | Summary quality drift | An agent that summarizes customer support tickets has been producing shorter summaries over the past week. No errors are logged, latency is stable, and token usage has decreased. Explain why traditional monitoring would not catch this issue, identify which observability signals would reveal it, and propose an alert rule that would detect this drift. |
| Coding | TraceSampler implementation | Write a TraceSampler class that implements head-based sampling for agent traces. The sampler should keep 100% of traces containing errors, 100% of traces where step count exceeds a configurable threshold, and a configurable percentage (default 10%) of all other traces. Include unit tests that verify each sampling rule. |
| Design | Multi-agent observability architecture | Design an observability architecture for a multi-agent system where five specialized agents collaborate to process insurance claims. Each agent has its own tools and LLM calls, and agents communicate through a shared message bus. Sketch the trace structure, identify which metrics are per-agent vs. system-wide, and explain how you would correlate traces across agents handling the same claim. |