Chapter 10 of 18
Defect Analysis & Regression Testing
Defect backlogs grow faster than teams can triage them. Regression suites grow faster than teams can maintain them. LLMs can bring order to both — classifying and prioritizing defects, then generating, healing, and analyzing regression tests automatically.
Part 3: Quality Assurance with LLMs
Defect Analysis & Regression Testing
Defects and regressions are the twin burdens of every QA team. Defect backlogs grow faster than teams can triage them. Regression suites grow faster than teams can maintain them. In this chapter, you will learn how LLMs can bring order to both: automatically classifying and prioritizing defects, then generating, healing, and intelligently analyzing regression tests.
Reading time: ~45 min Projects: Defect Triage Assistant · Smart Regression Suite
Part A: Defect Analysis and Triage
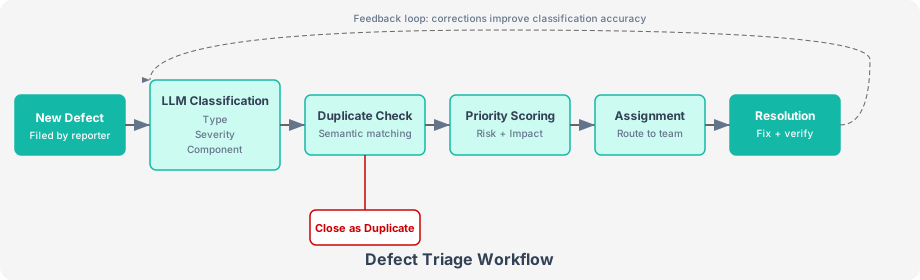
Figure 10-1. The LLM-powered defect triage workflow classifies, deduplicates, scores, and routes defects automatically, with a feedback loop that improves accuracy over time.

Figure 10-2. Defect pattern recognition groups related defects into clusters, revealing systemic issues like API integration fragility or recurring UI regressions, with trend indicators showing whether patterns are worsening.
10.1 The Defect Flood
A typical enterprise project accumulates defects at an alarming rate:
| Metric | Small Team (5 devs) | Medium Team (20 devs) | Large Team (100+ devs) |
|---|---|---|---|
| New defects per sprint | 10–20 | 40–80 | 200–500 |
| Backlog size (open defects) | 50–100 | 200–500 | 1,000–5,000+ |
| Duplicate rate | 10–15% | 15–25% | 25–40% |
| Time spent in triage meetings | 1 hr/week | 3–5 hrs/week | 10–20 hrs/week |
| Average time to triage a defect | 5 min | 5 min | 5 min |
| Total triage cost per sprint | 1.5 hrs | 6 hrs | 40+ hrs |
The cost is not just time. When a QA lead triages 50 defects in a one-hour meeting, each defect gets barely a minute of attention. Severity is assigned inconsistently, duplicates slip through, and high-impact bugs get buried under cosmetic issues.
Research by Capers Jones shows that a defect found in production costs 10–100x more to fix than one found during testing. A defect mislabeled as low priority during triage and left to fester until it hits production costs even more — the team had the information to fix it early and failed to act. Better triage prevents production incidents.
LLMs can process the full text of a defect report — title, description, steps to reproduce, stack traces, screenshots-to-text — and make classification decisions in seconds. This does not eliminate the need for human judgment, but it provides a strong first pass that reduces the time and cognitive load of triage.
10.2 Automated Defect Classification
The first step in taming the defect flood is consistent classification. LLMs can categorize defects along multiple dimensions simultaneously.
The classification prompt feeds the full defect report to the LLM and asks it to classify along five dimensions: defect type, affected component, root cause category, affected user segment, and reproducibility. It also extracts key symptoms, related features, and a suggested assignee team.
Consider a defect: "Payment fails intermittently for amounts over $10,000. The payment gateway returns a timeout error after 30 seconds. Smaller payments process normally. Happens more frequently on weekends." The classification output provides structured metadata that would take a human 3–5 minutes to determine:
| Dimension | Classification |
|---|---|
| Defect Type | Integration |
| Component | payment_gateway |
| Root Cause | third_party (gateway timeout under high-value transactions) |
| Reproducibility | Intermittent |
| Affected Users | specific_data_pattern (amounts > $10,000) |
| Assign To | payments_integration_team |
Track cases where the LLM's classification is overridden during triage. Feed these corrections back as few-shot examples in the prompt. After 50–100 corrections, classification accuracy typically improves from 70–75% out of the box to 85–90% after incorporating your team's patterns.
10.3 Root Cause Analysis with LLMs
Beyond classification, LLMs can perform preliminary root cause analysis by correlating the defect description with recent code changes, system architecture, and known issues. This transforms triage from "what happened?" to "why did it happen?" before a developer even looks at the bug.
The RCA prompt feeds the defect report alongside recent code changes and known issues. If the defect is a payment timeout and the commit history shows a recent change to "increase payment gateway timeout from 15s to 30s" and another to "add retry logic for failed gateway calls," the LLM correlates these signals to produce a hypothesis:
| Analysis Dimension | Finding |
|---|---|
| Probable Root Cause | The payment gateway has processing time that scales with transaction amount. The timeout increase from 15s to 30s masks the underlying issue — the gateway struggles with high-value transactions, possibly due to additional fraud checks above $10,000. |
| Confidence | Medium |
| Contributing Factors | Weekend processing coincides with batch settlement windows, adding gateway load. Retry logic may cause duplicate authorization attempts that further slow processing. |
| Investigation Steps | 1) Check gateway logs for transactions > $10K processing times. 2) Verify if additional fraud screening kicks in above a threshold. 3) Check for duplicate authorization requests from retry logic. 4) Compare weekend vs. weekday response times. |
Root cause analysis is hypothesis generation, not proof. The LLM's analysis is a starting point for investigation. Always verify with actual log analysis, code review, and debugging. The value is giving the developer a focused starting point rather than a blank slate.
10.4 Duplicate Detection
Duplicate defects waste everyone's time. The reporter spends time filing a bug that already exists. The triager spends time reading and classifying it. Sometimes the original and the duplicate get assigned to different developers who investigate the same issue. Industry data suggests 15–40% of defect reports are duplicates.
Traditional duplicate detection uses keyword matching and fails on bugs described in different words. LLMs understand semantics. They recognize that "login button unresponsive" and "cannot click sign-in after page loads" describe the same issue.
The LLM compares the new defect against each existing defect in the backlog, classifying each pair as duplicate (same underlying issue, different wording), related (same component, different issue), or unique. Each comparison includes a confidence score (0–1), reasoning, key similarities, and key differences. Results above a configurable threshold (default 0.7) are flagged as high-confidence matches.
For a new defect titled "Wire transfer over $10K gets stuck" compared against the existing backlog:
Verdict: DUPLICATE of BUG-4521

  Match: BUG-4521 (duplicate, confidence: 92%)
  Reason: Both describe the same issue — payment transactions over $10,000
  failing intermittently with a timeout. BUG-4590 specifically mentions
  wire transfer and weekend timing, which matches BUG-4521's pattern.

  Match: BUG-3998 (related, confidence: 35%)
  Reason: Both involve wire transfers but describe different issues —
  one is a timeout, the other is a validation error.
Batch Deduplication
For cleaning an entire backlog, process defects in sequence: compare each unprocessed defect against all remaining ones, identify duplicates above the confidence threshold, and build a cluster map. The canonical defect becomes the primary, and all duplicates are marked for closure. This approach typically finds 15–40% of defects are duplicates.
The most effective duplicate detection happens at filing time, not triage time. Add a pre-submission check: when a user starts typing a defect title, query the LLM to search for similar existing defects and display them. The reporter sees the existing bug and adds their information as a comment instead of creating a new ticket.
10.5 Severity and Priority Scoring
Severity (how bad is the bug?) and priority (how soon should we fix it?) are the two axes of defect triage. Teams routinely confuse them or apply them inconsistently. An LLM can apply a consistent scoring rubric across all defects.
The scoring rubric uses standard industry definitions. Severity measures impact: S1 (system crash, data loss, security breach), S2 (feature partially broken, no workaround), S3 (works with issues, workaround available), S4 (cosmetic). Priority measures urgency: P1 (fix now), P2 (this sprint), P3 (next sprint), P4 (backlog). The LLM weighs five factors: business impact, user impact, workaround availability, fix complexity, and regression risk.
When business context is included — "This is a B2B payment platform with 99.9% SLA, processing $2M daily, during Q4 peak season" — the scoring output provides both the rating and the reasoning, making triage decisions transparent and auditable:
SEVERITY: S2 Major
  Rationale: Payment feature is partially broken — transactions under $10K
  work, but high-value transactions fail 30% of the time. No data loss,
  but significant financial impact.

PRIORITY: P1 Immediate
  Rationale: B2B payment platform with $2M daily volume and 99.9% SLA.
  A 30% failure rate on high-value transactions during Q4 peak season
  represents significant revenue risk and potential SLA breach. The
  intermittent nature makes it harder for customers to work around.

Business impact: 9/10
User impact: 7/10
Fix complexity: medium
Recommended: current sprint (fix immediately)
Include 5–10 examples of previously triaged defects (with their final severity/priority) as few-shot examples in the prompt. This aligns the LLM's scoring with your team's actual standards. Different teams legitimately have different thresholds — a cosmetic bug on a medical device UI might be S2 for one team and S4 for another.
10.6 Defect Pattern Recognition
Individual defects are symptoms. Patterns across defects reveal systemic problems. An LLM can analyze your defect backlog and identify recurring patterns that point to architectural issues, process failures, or skill gaps.
The pattern analysis examines a batch of defects across six dimensions: component hotspots, root cause clusters, temporal patterns (clustered around releases or sprints?), regression patterns (areas that keep breaking after fixes), process gaps (requirements, code review, or testing failures), and skill gaps. For each pattern found, it provides evidence, frequency, business impact, a recommendation, and effort estimate.
For a batch of eight defects, the pattern analysis reveals:
| Pattern | Evidence | Recommendation |
|---|---|---|
| Payment module instability | 5 of 8 defects in payments | Dedicated code review for payment module; add integration test suite |
| Third-party integration fragility | BUG-4521, BUG-4489, BUG-4401 | Add circuit breaker pattern; implement gateway health monitoring |
| Concurrency/retry issues | BUG-4455, BUG-4401 | Review idempotency implementation; add transaction deduplication |
| Boundary/precision errors | BUG-4380, BUG-4267 | Add boundary value tests to CI pipeline; review numeric handling |
Finding a pattern is the first step. The real value is acting on it. If 60% of defects come from the payment module, the solution is not to assign more QAs to payment testing — it is to improve the payment module's code quality through better reviews, more integration tests, and possibly architectural refactoring. Patterns should drive systemic improvement, not just reactive fixing.
10.7 Regression Risk Assessment
Every bug fix carries regression risk. The fix might break something else. LLMs can assess this risk by analyzing the defect, the likely fix, and the system's dependency graph to predict what else might be affected.
For a payment timeout fix involving amount-based timeout scaling and async processing with webhook callback in a service used by three other microservices (billing, invoicing, reconciliation), a regression risk assessment might produce:
REGRESSION RISK SCORE: 7/10

DIRECTLY AFFECTED:
  - PaymentGateway.processTransaction() — timeout logic change
  - Payment webhook handler — new async callback flow
  - Payment status tracking — new "processing_async" state

INDIRECTLY AFFECTED:
  - Billing service — relies on synchronous payment confirmation
  - Invoicing — generates invoice after payment success callback
  - Reconciliation — end-of-day batch may not pick up async payments
  - Customer notification — "payment successful" email timing changes

REGRESSION TESTS TO RUN:
  - All payment integration tests
  - Billing-to-payment integration tests
  - Invoice generation after payment tests
  - Reconciliation batch processing tests
  - Payment notification timing tests

DEPLOYMENT: Deploy in isolation during low-traffic window. Do NOT
bundle with other changes. Monitor payment success rate for 2 hours
post-deployment.

ROLLBACK: Feature flag the async processing path. If issues detected,
disable flag to revert to synchronous-only processing.
A regression risk score of 7/10 means fix it carefully — not don't fix it. The worst outcome is fixing a bug quickly without considering regression, then causing a production incident worse than the original bug.
Project A: Defect Triage Assistant
Build an end-to-end defect triage assistant that processes incoming defect reports and produces a triage recommendation for each one.
Project Requirements
- Accept defect reports in JSON format (individual or batch)
- Classify each defect by type, component, and root cause
- Check for duplicates against existing backlog
- Score severity and priority using a configurable rubric
- Perform preliminary root cause analysis
- Generate a triage summary report
- Track triage decision accuracy over time
Pipeline Steps
The Defect Triage Assistant processes each incoming defect through five stages:
- Classification: categorize by type, component, root cause, and reproducibility
- Duplicate check: compare against existing backlog using semantic matching
- Severity/Priority scoring: apply the standardized rubric with business context
- Root cause analysis: correlate with recent code changes and known issues
- Recommendation: generate a human-readable triage summary — close as duplicate, assign to team, or escalate
Extension Ideas
- Add a feedback mechanism where triagers can accept or override LLM recommendations, building a training dataset
- Integrate with Jira/GitHub Issues to pull defects automatically and push triage results back
- Build a dashboard showing triage accuracy, common patterns, and backlog health over time
- Add Slack/Teams notifications for P1 defects that need immediate attention
Part B: Regression Testing and Automation
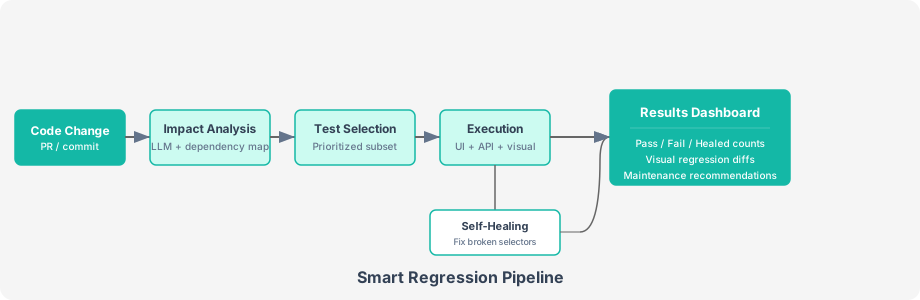
Figure 10-3. The smart regression pipeline uses LLMs at every stage: analyzing code change impact, selecting the most relevant tests, self-healing broken selectors during execution, and producing an actionable results dashboard.
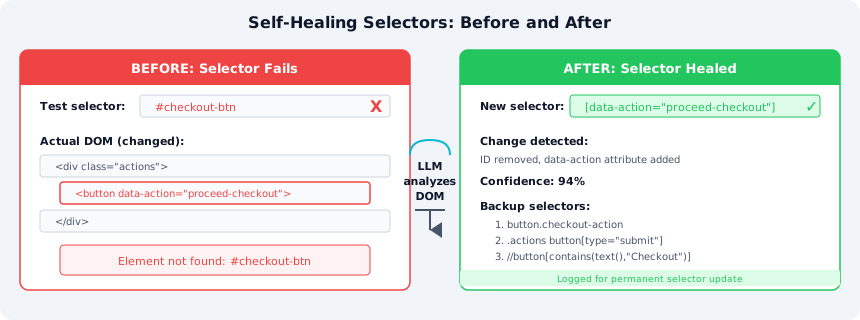
Figure 10-4. Self-healing selectors: when a test selector breaks (left), the LLM analyzes the current DOM to find the intended element and generates a new selector with backup alternatives (right), keeping tests running while flagging selectors for permanent update.
10.8 The Regression Burden
Regression testing consumes a disproportionate share of the QA budget. As applications grow, the regression suite grows with them. The time available per release stays the same. The math is unforgiving:
| Release Cycle | Regression Suite Size | Execution Time | Maintenance Effort |
|---|---|---|---|
| Year 1 | 200 tests | 2 hours | 5% of QA time |
| Year 2 | 600 tests | 6 hours | 15% of QA time |
| Year 3 | 1,500 tests | 14 hours | 30% of QA time |
| Year 5 | 4,000+ tests | 36+ hours | 50%+ of QA time |
By year five, half the QA team's time goes to maintaining the regression suite — fixing broken selectors, updating test data, adjusting for UI changes. Finding new bugs takes a back seat.
LLMs offer a way out by automating the three most time-consuming parts:
- Test creation: Generating executable test scripts from natural-language descriptions
- Test maintenance: Self-healing selectors that adapt to UI changes without manual updates
- Test analysis: Intelligent failure analysis that distinguishes real bugs from test flakiness
Typically, 20% of your regression tests catch 80% of regression bugs. The other 80% exist "just in case" and rarely fail. LLM-based test prioritization can identify which tests matter most, letting you run a targeted 30-minute suite instead of the full 14-hour suite for fast feedback.
10.9 Test Script Generation
The most direct application of LLMs to regression testing is generating executable test scripts from natural-language test cases. Instead of manually translating "verify that clicking the Submit button on the checkout page creates an order" into Selenium code, the LLM does the translation.
The prompt provides the LLM with the test case (title, preconditions, steps, expected result), the target framework, and optionally a snippet of the page's HTML structure. The LLM generates a complete test script following best practices: Page Object Model pattern for UI tests, explicit waits instead of sleep(), meaningful assertions with descriptive error messages, and a preference for data-testid selectors over fragile CSS classes or XPath.
For a checkout flow test case with seven steps, the LLM produces a Playwright test with a CheckoutPage class encapsulating all form locators and fill methods, and a TestCheckout class with the actual test that navigates through shipping, payment, and order confirmation, complete with URL assertions and element visibility checks.
If you include a snippet of the page's HTML structure in the prompt, the LLM generates selectors that actually match your application rather than guessing at data-testid names. Extract the relevant HTML using browser DevTools and paste it in.
Batch Test Generation
For generating an entire test suite, process multiple test cases and organize them into test files by feature area. The pipeline groups test cases by feature tag, generates a script for each, and writes combined test files like test_checkout.py and test_auth.py. Each file contains all test classes and Page Objects for that feature area.
10.10 Self-Healing Test Selectors
The number one cause of test maintenance is broken selectors. A developer renames a CSS class, changes an element's ID, or restructures the DOM — and suddenly dozens of tests fail. Not because of a real bug. The test cannot find the element it is looking for.
Self-healing selectors use LLMs to analyze the page's current DOM and find the intended element even when the original selector breaks. The approach works in three steps: try the original selector; if it fails, capture the current page structure; ask the LLM to locate the intended element.
The LLM returns a new primary selector, 2–3 backup selectors using different strategies, a confidence score, and a description of what changed in the DOM. It prefers selectors in this order: data-testid (most stable), aria-label or role (accessibility-based), CSS with structural context, and XPath as a last resort. If confidence drops below 50%, healing is rejected and the test fails normally.
All healing events are logged for later review. Self-healing selectors keep tests running when the DOM changes, but they should trigger a maintenance task to permanently update the selector. If a test heals itself every run, it is adding LLM API call latency and cost. Use the healing report to batch-update broken selectors on a regular cadence.
10.11 Visual Regression with LLMs
Traditional visual regression tools compare screenshots pixel-by-pixel or use perceptual hashing. They generate false positives for intentional UI changes (a new button color) and miss subtle bugs (text overlapping an image on specific viewport widths). LLMs can look at two screenshots and make a semantic judgment: whether a difference is an intentional layout change or a rendering bug.
The LLM classifies each difference as an intentional change (update baseline), a visual bug (file defect), or a content change (data update). The test only fails for actual visual bugs — intentional changes are accepted and the baseline is updated.
A typical visual regression result:
| Location | Classification | Description | Action |
|---|---|---|---|
| Header navigation | Intentional change | New "Deals" menu item added between "Products" and "Support" | Update baseline |
| Product card grid | Visual bug | Third product card overflows its container on mobile viewport — price text truncated | File bug |
| Footer | Content change | Copyright year updated from 2025 to 2026 | Update baseline |
| Hero banner | No change | Identical | None |
Use a fast pixel-diff tool (like pixelmatch or BackstopJS) as a first pass to identify screenshots that changed. Then send only the changed screenshots to the LLM for semantic analysis. This reduces LLM API costs: you pay only for analysis of screenshots that actually differ.
10.12 API Test Automation
API regression tests are often simpler to automate than UI tests, but writing them is still tedious. You need to construct request payloads, set up authentication, define expected responses, and handle edge cases. LLMs generate comprehensive API tests from endpoint documentation.
You provide the endpoint specification (method, path, request body schema, and expected response codes) and the LLM generates tests covering five categories: happy path, validation errors (missing/invalid fields), authentication failures, edge cases (empty arrays, boundary values), and idempotency checks.
For a POST /api/v2/orders endpoint, the LLM produces seven test methods covering order creation success (assert 201, verify order_id and total), missing auth (assert 401), missing required fields via @pytest.mark.parametrize (assert 400 for each), empty items array, quantity exceeding maximum, idempotency verification, and response time threshold.
If your API has an OpenAPI (Swagger) specification, feed it directly to the LLM to generate contract tests. The LLM validates that every endpoint defined in the spec has corresponding tests and that request/response schemas match — catching spec drift when the API implementation diverges from its documentation.
10.13 Performance Test Scenarios
Performance regressions are among the hardest bugs to catch because they require realistic load patterns. LLMs can analyze anonymized production traffic logs and generate load test scenarios that mimic real user behavior, including traffic spikes, concurrent operations, and usage pattern variations.
The LLM generates scenarios covering different performance risk areas:
| Scenario | Users | Pattern | Duration | What It Tests |
|---|---|---|---|---|
| Normal load baseline | 500 | Steady state | 30 min | Performance under typical conditions |
| Peak hour simulation | 2,000 | Ramp up over 10 min | 60 min | Behavior at peak capacity |
| Flash sale spike | 5,000 | Sudden spike | 15 min | System response to unexpected traffic surge |
| Endurance soak test | 300 | Steady state | 8 hours | Memory leaks, connection pool exhaustion |
| Database stress | 1,000 | Read-heavy mix | 30 min | Query performance, connection pooling |
Performance tests must run against production-like infrastructure. Running a 2,000-user load test against a development server proves nothing. Ensure your performance test environment mirrors production in server specs, database size, network topology, and third-party service behavior.
10.14 Test Maintenance Strategies
Generating tests is the easy part. Keeping them healthy over months and years is where most teams fail. LLMs help with test maintenance by analyzing test failures, identifying flaky tests, and suggesting when tests should be retired or refactored.
Feed the LLM each test's execution history from the last 30 runs: pass/fail counts, average duration, last real bug caught, last modification date, and number of maintenance events. The LLM evaluates five dimensions per test: failure pattern (consistent vs. intermittent), flakiness score, value assessment (does it catch real bugs?), maintenance cost, and recommendation.
The maintenance analysis produces actionable recommendations:
| Test | Recommendation | Rationale |
|---|---|---|
| test_login_valid_credentials | KEEP | Stable, fast, covers critical flow. No changes needed. |
| test_search_results_count | RETIRE | 40% failure rate, never caught a real bug, 7 maintenance events. The test validates a dynamic count that changes with data, not actual search functionality. Replace with test_search_returns_relevant_results. |
| test_checkout_with_coupon | KEEP | Stable, recently caught a real bug, reasonable maintenance cost. |
| test_product_image_loads | REFACTOR | Flaky due to network-dependent image loading. Replace direct image load check with a check for the img element's src attribute and a HEAD request to the CDN, removing the visual rendering dependency. |
Run the health analysis once per month as part of your CI/CD pipeline. Track the health score over time. A declining health score means tests are accumulating faster than they are being maintained.
Project B: Smart Regression Suite
Build a smart regression testing pipeline that uses LLMs at every stage — from test generation through execution analysis — to create a self-maintaining regression suite.
Project Requirements
- Accept test cases in natural language and generate executable Playwright or pytest scripts
- Implement self-healing selectors that log healing events for later review
- Add visual regression checks using LLM screenshot comparison
- Generate API regression tests from endpoint specifications
- Analyze test results to identify flaky tests and suggest maintenance actions
- Produce a comprehensive regression report after each run
Pipeline Steps
- Test generation: convert natural-language test cases into executable Playwright or pytest scripts, organized by feature area
- Visual regression: compare baseline and current screenshots for each page, classifying differences as intentional changes or bugs
- Self-healing execution: run tests with self-healing selectors that log all healing events for later permanent updates
- Run analysis: analyze test results for flaky tests, maintenance recommendations, and a suite health score, producing a JSON report and human-readable summary
Extension Ideas
- Add CI/CD integration with GitHub Actions or Jenkins to run the suite on every PR
- Build a Slack bot that posts the regression report summary and alerts on P1 failures
- Implement test impact analysis: given a code diff, predict which tests are most likely to be affected and run only those
- Add cross-browser testing by parameterizing the Playwright browser engine (Chromium, Firefox, WebKit)
- Create a historical trends dashboard showing test stability, execution time, and defect detection rate over time
Exercises
- Classify your backlog. Export 20 defects from your project's bug tracker and run them through the classification pipeline. How accurately does the LLM categorize them compared to the human-assigned labels?
- Duplicate hunt. Run the duplicate detection across your last 50 defects. How many duplicates does it find? Were any already known? Were any surprises?
- Scoring calibration. Take 10 defects that your team has already triaged. Compare the LLM's severity/priority scores against the team's decisions. Where do they disagree, and who is right?
- Generate and run. Write three test cases for a web application you work with. Use the script generator to create Playwright tests. Run them. How many pass on the first try? What needed manual adjustment?
- Break and heal. Take a working test, manually change a selector to something incorrect, and run the self-healing locator. Does it find the right element? What confidence score does it report?
- Visual regression pilot. Capture baseline screenshots for five pages of your application. Make one intentional UI change and one bug (e.g., hide an element with CSS). Run the visual comparison. Does the LLM correctly classify which is intentional and which is a bug?
- Suite health audit. Export execution results from your last 30 test runs. Run the health analysis. Which tests does it recommend retiring, and do you agree?