Chapter 15 of 20
Deployment
The agent passed every test on your laptop. You merged the PR on Friday, pushed to production, and went home. By Saturday morning the on-call engineer had paged you three times: OOM-killed every forty minutes, API gateway routing to a stale replica with the old prompt template, and $1,200 in token spend overnight — ten times the daily budget. Nothing was technically broken. Everything worked in isolation. The system failed because nobody had designed the space between the components.
Part 4: Production
Deployment
The agent passed every test on your laptop. You merged the PR on Friday afternoon, pushed to production, and went home. By Saturday morning the on-call engineer had paged you three times: the container was OOM-killed every forty minutes, the API gateway was routing traffic to a stale replica that still loaded the old prompt template, and the cost dashboard showed $1,200 in token spend overnight — ten times the daily budget. Nothing was technically "broken." Every component worked in isolation. The system failed because nobody had designed the space between the components: the pipeline that builds, the container that runs, the orchestrator that scales, and the monitors that tell you when reality diverges from your assumptions.
15.1 Why Deployment Is Different for Agents
A traditional web API is stateless by convention: every request carries everything the server needs. An agentic service is different in three ways that change how you deploy it. First, a single user request can trigger dozens of LLM calls, tool invocations, and memory lookups, turning a "simple endpoint" into a long-running, resource-intensive workflow. Second, the behavior of the system depends on prompt templates, model versions, and retrieval indices that sit outside the application code — a code deploy that does not update the prompt registry is a partial deploy. Third, latency profiles are unpredictable: one request may resolve in 800ms, the next may chain five tool calls and take twelve seconds. Standard autoscaling heuristics built for uniform request latencies break down.
These properties mean that agent deployment requires treating prompts as versioned artifacts, treating model endpoints as external dependencies with SLAs, and designing infrastructure that tolerates wide variance in per-request resource consumption.
Common Mistake: The Friday Deploy Trap
Agent systems have a failure mode that traditional services do not: the code can be correct and the infrastructure healthy, but the model returns different outputs after a provider-side update. If you deploy on Friday and the model provider pushes a minor version change over the weekend, your agent's behavior shifts with no corresponding entry in your deploy log. Pin model versions explicitly and treat model changes as deployments that require their own testing cycle.
15.2 Containerization
Containers solve the "works on my machine" problem by packaging your application, its dependencies, and its runtime into a single immutable artifact. For agent services, your Dockerfile must capture not just Python packages but also prompt templates, embedding model files (if running locally), and configuration that tells the agent which external services to reach.
# Dockerfile for an agentic service
FROM python:3.12-slim AS base

# System deps for common agent tooling (e.g., PDF parsing, web scraping)
RUN apt-get update && apt-get install -y --no-install-recommends \
    build-essential libpq-dev curl \
    && rm -rf /var/lib/apt/lists/*

WORKDIR /app

# Install Python dependencies first (cache-friendly layer ordering)
COPY requirements.txt .
RUN pip install --no-cache-dir -r requirements.txt

# Copy application code and prompt templates
COPY src/ ./src/
COPY prompts/ ./prompts/
COPY config/ ./config/

# Non-root user for security
RUN useradd --create-home appuser
USER appuser

# Health check endpoint
HEALTHCHECK --interval=30s --timeout=5s --retries=3 \
    CMD curl -f http://localhost:8000/health || exit 1

EXPOSE 8000
CMD ["uvicorn", "src.main:app", "--host", "0.0.0.0", "--port", "8000"]
Three Dockerfile practices matter more for agents than for typical web services:
Layer ordering for cache efficiency. Requirements change less frequently than application code. Prompt templates change more frequently than either. Order your COPY instructions accordingly so that a prompt update does not invalidate the dependency-installation layer.
Multi-stage builds for size. If your agent uses heavy dependencies for document processing or local model inference, use a multi-stage build: install and compile in a builder stage, then copy only the runtime artifacts into the final slim image. A 200MB image starts faster than a 2GB image, and start time matters when your autoscaler spins up new replicas under load.
No secrets in the image. API keys, database credentials, and model endpoint URLs must never be baked into the container image. They are injected at runtime via environment variables or a secrets manager. An image with embedded secrets is a security incident waiting to be discovered in a container registry.
# docker-compose.yml for local development
version: "3.9"

services:
  agent:
    build: .
    ports:
      - "8000:8000"
    env_file:
      - .env.development
    volumes:
      - ./prompts:/app/prompts    # Hot-reload prompts in dev
      - ./src:/app/src
    depends_on:
      redis:
        condition: service_healthy
      postgres:
        condition: service_healthy

  redis:
    image: redis:7-alpine
    ports:
      - "6379:6379"
    healthcheck:
      test: ["CMD", "redis-cli", "ping"]
      interval: 10s
      timeout: 3s
      retries: 3

  postgres:
    image: pgvector/pgvector:pg16
    environment:
      POSTGRES_DB: agent_db
      POSTGRES_USER: agent
      POSTGRES_PASSWORD: localdev
    ports:
      - "5432:5432"
    healthcheck:
      test: ["CMD-SHELL", "pg_isready -U agent"]
      interval: 10s
      timeout: 3s
      retries: 3
Mount source code and prompt directories as volumes in development for hot-reloading, but never in production. In production, everything runs from the baked image. This ensures that what you tested is exactly what runs.
15.3 CI/CD Pipelines
Continuous integration for agent services has a step that traditional CI does not: prompt and behavior testing. Your pipeline must verify not just that the code compiles and unit tests pass, but that the agent produces acceptable outputs for a suite of reference inputs. This is inherently non-deterministic, so your CI must handle fuzzy assertions.
# .github/workflows/deploy.yml
name: Build & Deploy Agent

on:
  push:
    branches: [main]
  pull_request:
    branches: [main]

jobs:
  test:
    runs-on: ubuntu-latest
    steps:
      - uses: actions/checkout@v4

      - name: Set up Python
        uses: actions/setup-python@v5
        with:
          python-version: "3.12"

      - name: Install dependencies
        run: pip install -r requirements.txt -r requirements-dev.txt

      - name: Unit tests
        run: pytest tests/unit/ -v --tb=short

      - name: Prompt regression tests
        env:
          OPENAI_API_KEY: ${{ secrets.OPENAI_API_KEY }}
        run: pytest tests/prompts/ -v --tb=short -k "not slow"

      - name: Lint & type check
        run: |
          ruff check src/
          mypy src/ --ignore-missing-imports

  build-and-push:
    needs: test
    if: github.ref == 'refs/heads/main'
    runs-on: ubuntu-latest
    steps:
      - uses: actions/checkout@v4

      - name: Build container image
        run: |
          docker build -t agent-service:${{ github.sha }} .
          docker tag agent-service:${{ github.sha }} \
            ${{ secrets.REGISTRY }}/agent-service:${{ github.sha }}
          docker tag agent-service:${{ github.sha }} \
            ${{ secrets.REGISTRY }}/agent-service:latest

      - name: Push to registry
        run: |
          echo "${{ secrets.REGISTRY_PASSWORD }}" | \
            docker login ${{ secrets.REGISTRY }} -u ${{ secrets.REGISTRY_USER }} --password-stdin
          docker push ${{ secrets.REGISTRY }}/agent-service:${{ github.sha }}
          docker push ${{ secrets.REGISTRY }}/agent-service:latest

  deploy-staging:
    needs: build-and-push
    runs-on: ubuntu-latest
    steps:
      - name: Deploy to staging
        run: |
          kubectl set image deployment/agent-service \
            agent=${{ secrets.REGISTRY }}/agent-service:${{ github.sha }} \
            --namespace=staging
          kubectl rollout status deployment/agent-service \
            --namespace=staging --timeout=300s

  deploy-production:
    needs: deploy-staging
    runs-on: ubuntu-latest
    environment: production
    steps:
      - name: Deploy to production (canary)
        run: |
          kubectl set image deployment/agent-service-canary \
            agent=${{ secrets.REGISTRY }}/agent-service:${{ github.sha }} \
            --namespace=production
          kubectl rollout status deployment/agent-service-canary \
            --namespace=production --timeout=300s
The pipeline has four stages, and the ordering is deliberate. Unit tests run first because they are fast and deterministic. Prompt regression tests run second because they call an LLM and are slower — if unit tests fail, you do not waste API credits. The build stage produces an immutable image tagged with the commit SHA, not latest alone, so every deployment is traceable to a specific commit. Production uses a canary deployment, and the environment: production gate requires manual approval before full rollout.
Production Consideration: Prompt Regression Tests in CI
Prompt tests should use a fixed model version (not gpt-4o but gpt-4o-2024-08-06) and a temperature of 0. Assert on structural properties of the output — JSON schema compliance, presence of required fields, absence of forbidden content — rather than exact string matches. Store expected outputs as fixtures and update them deliberately when prompts change, treating them as you would database migration files.
15.4 Environment Management
An agent service typically depends on three categories of configuration: infrastructure (database URLs, cache endpoints), model configuration (API keys, model names, temperature settings), and behavior configuration (prompt template versions, tool enablement flags, rate limits). Mixing these together in a single .env file works for a weekend project. In production, they need different management strategies.
# config/settings.py — Typed configuration with validation
from pydantic_settings import BaseSettings
from pydantic import Field


class InfraConfig(BaseSettings):
    """Infrastructure endpoints — sourced from environment variables."""
    database_url: str = Field(..., alias="DATABASE_URL")
    redis_url: str = Field("redis://localhost:6379", alias="REDIS_URL")
    log_level: str = Field("INFO", alias="LOG_LEVEL")

    model_config = {"env_prefix": "", "case_sensitive": True}


class ModelConfig(BaseSettings):
    """Model and provider configuration."""
    openai_api_key: str = Field(..., alias="OPENAI_API_KEY")
    model_name: str = Field("gpt-4o-2024-08-06", alias="MODEL_NAME")
    temperature: float = Field(0.1, alias="MODEL_TEMPERATURE")
    max_tokens: int = Field(4096, alias="MODEL_MAX_TOKENS")
    embedding_model: str = Field("text-embedding-3-small", alias="EMBEDDING_MODEL")

    model_config = {"env_prefix": "", "case_sensitive": True}


class AgentConfig(BaseSettings):
    """Agent behavior configuration."""
    prompt_version: str = Field("v2.3", alias="PROMPT_VERSION")
    max_tool_calls: int = Field(10, alias="MAX_TOOL_CALLS")
    enable_web_search: bool = Field(True, alias="ENABLE_WEB_SEARCH")
    rate_limit_rpm: int = Field(60, alias="RATE_LIMIT_RPM")
    fallback_model: str = Field("gpt-4o-mini", alias="FALLBACK_MODEL")

    model_config = {"env_prefix": "", "case_sensitive": True}


class Settings:
    """Aggregate configuration."""
    def __init__(self):
        self.infra = InfraConfig()
        self.model = ModelConfig()
        self.agent = AgentConfig()

settings = Settings()
Secrets (API keys, database passwords) belong in a secrets manager such as AWS Secrets Manager, HashiCorp Vault, or your cloud provider's equivalent, injected into the container at startup. Non-secret configuration (model names, feature flags) can live in ConfigMaps, environment variables, or a configuration service.
| Config Category | Examples | Storage | Change Frequency |
|---|---|---|---|
| Infrastructure | Database URL, Redis host, port numbers | ConfigMap / env vars | Rarely — infrastructure changes |
| Secrets | API keys, DB passwords, signing keys | Secrets manager | On rotation schedule |
| Model config | Model name, temperature, max tokens | ConfigMap or feature flags | Per experiment / prompt version |
| Behavior flags | Tool enablement, rate limits, fallback rules | Feature flag service | Frequently — operational tuning |
15.5 Scaling Strategies
Agent workloads scale differently from web APIs because request duration varies by orders of magnitude. A typical REST endpoint returns in 50–200ms. An agent that chains three tool calls through an LLM might take 5–15 seconds. A pod handling 10 concurrent requests is not "10x the CPU load of one request." It is 10 long-lived connections consuming memory for context, open connections to external APIs, and potentially queued callbacks.
Horizontal scaling is the primary strategy: run multiple replicas behind a load balancer, each stateless (conversation state lives in Redis or a database, not in process memory).
# kubernetes/deployment.yaml
apiVersion: apps/v1
kind: Deployment
metadata:
  name: agent-service
  namespace: production
spec:
  replicas: 3
  strategy:
    type: RollingUpdate
    rollingUpdate:
      maxUnavailable: 1
      maxSurge: 1
  selector:
    matchLabels:
      app: agent-service
  template:
    metadata:
      labels:
        app: agent-service
    spec:
      containers:
        - name: agent
          image: registry.example.com/agent-service:abc123
          ports:
            - containerPort: 8000
          resources:
            requests:
              cpu: "500m"
              memory: "512Mi"
            limits:
              cpu: "2000m"
              memory: "2Gi"
          env:
            - name: OPENAI_API_KEY
              valueFrom:
                secretKeyRef:
                  name: agent-secrets
                  key: openai-api-key
            - name: DATABASE_URL
              valueFrom:
                configMapKeyRef:
                  name: agent-config
                  key: database-url
          readinessProbe:
            httpGet:
              path: /health
              port: 8000
            initialDelaySeconds: 10
            periodSeconds: 15
          livenessProbe:
            httpGet:
              path: /health
              port: 8000
            initialDelaySeconds: 30
            periodSeconds: 30
            failureThreshold: 3
---
apiVersion: autoscaling/v2
kind: HorizontalPodAutoscaler
metadata:
  name: agent-service-hpa
  namespace: production
spec:
  scaleTargetRef:
    apiVersion: apps/v1
    kind: Deployment
    name: agent-service
  minReplicas: 2
  maxReplicas: 20
  metrics:
    - type: Resource
      resource:
        name: cpu
        target:
          type: Utilization
          averageUtilization: 60
    - type: Pods
      pods:
        metric:
          name: active_agent_sessions
        target:
          type: AverageValue
          averageValue: "8"
The autoscaler above uses two signals: CPU utilization and a custom metric (active_agent_sessions) that counts in-flight agent workflows per pod. CPU alone is misleading for agent workloads because much of the wall-clock time is spent waiting for external LLM API responses, not consuming CPU. The custom metric ensures scaling responds to actual concurrency pressure.
Production Consideration: Memory Limits Matter
Set memory limits explicitly. An agent processing a large document corpus can accumulate context in memory before sending it to the LLM. Without a memory limit, one runaway request can consume all available memory on the node, killing other pods via the OOM killer. A 2Gi limit with a 512Mi request gives each pod burst room while protecting the cluster.
15.6 Load Balancing and Health Checks
Round-robin distribution sends request N to pod A and request N+1 to pod B, regardless of whether pod A is still processing a ten-second agent chain. This leads to uneven load: some pods accumulate long requests while others sit idle.
Least-connections routing is a better default. The load balancer sends each new request to the pod with the fewest active connections, naturally distributing work based on actual capacity.
# src/health.py — Health check endpoints for agent services
from fastapi import APIRouter, Response
import time
import psutil

router = APIRouter()

# Track application state
_start_time = time.time()
_ready = False


def set_ready(ready: bool):
    global _ready
    _ready = ready


@router.get("/health")
async def liveness():
    """Liveness probe: is the process alive and responsive?"""
    return {"status": "alive", "uptime_seconds": int(time.time() - _start_time)}


@router.get("/ready")
async def readiness(response: Response):
    """Readiness probe: can this instance accept traffic?"""
    if not _ready:
        response.status_code = 503
        return {"status": "not_ready", "reason": "initialization_in_progress"}
    return {"status": "ready"}


@router.get("/health/detailed")
async def detailed_health():
    """Detailed health for dashboards and debugging."""
    memory = psutil.Process().memory_info()
    return {
        "status": "alive",
        "uptime_seconds": int(time.time() - _start_time),
        "memory_rss_mb": round(memory.rss / 1_048_576, 1),
        "cpu_percent": psutil.cpu_percent(interval=0.1),
        "ready": _ready,
    }
Two distinct health endpoints serve different purposes. The liveness probe answers: "Is this process alive?" Keep this check trivial — if the HTTP server can respond, the process is alive. The readiness probe answers: "Can this instance serve traffic?" During startup, while the agent loads prompt templates or warms a local embedding model, readiness returns 503. The load balancer will not send traffic until readiness passes.
A common mistake is making the liveness probe depend on an external service (the database, the LLM API). If the LLM provider has a brief outage, your liveness probe fails, the orchestrator restarts all your pods simultaneously, and you create a thundering herd of reconnections that makes the situation worse. Liveness checks only the process itself. Readiness can check external dependencies.
15.7 Graceful Degradation
Production agent systems must continue providing value when components fail. The LLM provider will have outages. Your vector database will have latency spikes. The web search tool will return timeouts. Graceful degradation means designing each failure mode in advance and providing a reduced but functional experience instead of a 500 error.
# src/resilience.py — Fallback and degradation patterns
import asyncio
import openai
from typing import Optional


class ResilientAgent:
    """Agent with multi-layer fallback for LLM calls."""

    def __init__(self, settings):
        self.primary_model = settings.model.model_name
        self.fallback_model = settings.agent.fallback_model
        self.client = openai.AsyncOpenAI()
        self.max_retries = 2
        self.timeout = 30.0

    async def complete(self, messages: list[dict]) -> str:
        """Try primary model, fall back to secondary, then to cached response."""
        # Layer 1: Primary model
        result = await self._try_model(self.primary_model, messages)
        if result is not None:
            return result

        # Layer 2: Fallback model (cheaper, faster, more available)
        result = await self._try_model(self.fallback_model, messages)
        if result is not None:
            return result

        # Layer 3: Static fallback
        return self._static_fallback(messages)

    async def _try_model(self, model: str, messages: list[dict]) -> Optional[str]:
        """Attempt completion with retries and timeout."""
        for attempt in range(self.max_retries):
            try:
                response = await asyncio.wait_for(
                    self.client.chat.completions.create(
                        model=model,
                        messages=messages,
                        temperature=0.1,
                    ),
                    timeout=self.timeout,
                )
                return response.choices[0].message.content
            except openai.RateLimitError:
                await asyncio.sleep(2 ** attempt)
            except (openai.APIError, asyncio.TimeoutError):
                await asyncio.sleep(1)
            except Exception:
                break
        return None

    def _static_fallback(self, messages: list[dict]) -> str:
        """Return a safe static response when all models are unavailable."""
        return (
            "I'm currently experiencing high demand and cannot process your "
            "request in full. Please try again in a few minutes, or contact "
            "support if this persists."
        )
The fallback stack has three layers. The primary model handles normal traffic. When it fails — rate limits, timeouts, provider outages — the agent falls back to a cheaper, smaller model often hosted by a different provider. If both LLM providers are down, a static response tells the user what happened instead of crashing. Each layer is worse than the one above it, but every layer is better than a 500 error.
Under the Hood: Circuit Breakers
After a model endpoint fails three times in a row, stop calling it for 60 seconds. This "circuit breaker" pattern prevents your service from burning through retries and timeout budget on a provider that is clearly down. After the cooldown, send one probe request. If it succeeds, close the circuit and resume normal traffic. Libraries like tenacity with custom retry logic or dedicated circuit-breaker packages like pybreaker implement this pattern.
Graceful degradation extends beyond LLM calls. If the vector database is slow, serve answers from a cache of recent queries. If a tool times out, skip it and tell the user which information could not be retrieved. If the memory store is down, operate in stateless mode and warn the user that conversation history is temporarily unavailable. Each degradation should be logged with a severity level so your monitoring system can alert on patterns, not just individual failures.
15.8 Cost Management
LLM inference is the dominant cost in most agent deployments, and it scales with usage in ways that infrastructure costs do not. A server costs the same whether it handles one request or a thousand. An LLM call costs per token, and an agent that chains five calls per user request multiplies that cost by five. Without controls, a popular feature or a misbehaving loop can generate a five-figure bill overnight.
# src/cost_tracking.py — Per-request cost tracking
from dataclasses import dataclass, field
import time


# Approximate cost per 1M tokens (USD) as of 2025
MODEL_COSTS = {
    "gpt-4o-2024-08-06":     {"input": 2.50, "output": 10.00},
    "gpt-4o-mini-2024-07-18": {"input": 0.15, "output": 0.60},
    "claude-sonnet-4-20250514": {"input": 3.00, "output": 15.00},
}


@dataclass
class RequestCostTracker:
    """Track token usage and cost across multiple LLM calls in one request."""
    request_id: str
    calls: list[dict] = field(default_factory=list)
    budget_usd: float = 0.50  # Per-request budget

    def record_call(self, model: str, input_tokens: int, output_tokens: int):
        costs = MODEL_COSTS.get(model, {"input": 5.0, "output": 15.0})
        cost = (input_tokens * costs["input"] + output_tokens * costs["output"]) / 1_000_000
        self.calls.append({
            "model": model,
            "input_tokens": input_tokens,
            "output_tokens": output_tokens,
            "cost_usd": round(cost, 6),
            "timestamp": time.time(),
        })

    @property
    def total_cost(self) -> float:
        return sum(c["cost_usd"] for c in self.calls)

    @property
    def budget_remaining(self) -> float:
        return max(0, self.budget_usd - self.total_cost)

    def is_over_budget(self) -> bool:
        return self.total_cost >= self.budget_usd

    def summary(self) -> dict:
        return {
            "request_id": self.request_id,
            "total_calls": len(self.calls),
            "total_input_tokens": sum(c["input_tokens"] for c in self.calls),
            "total_output_tokens": sum(c["output_tokens"] for c in self.calls),
            "total_cost_usd": round(self.total_cost, 4),
            "budget_usd": self.budget_usd,
            "over_budget": self.is_over_budget(),
        }
Four cost controls that prevent bill shock:
Per-request budgets. Set a maximum dollar amount per user request. When the agent has consumed its budget, it must return its best answer so far rather than making additional LLM calls. This caps the worst-case cost of any single interaction.
Daily and monthly spending limits. Alert at 80% of the monthly budget. Automatically switch to the fallback model at 95%. Hard-stop all non-critical traffic at 100%.
Model tiering. Route simple requests (classification, short answers) to cheaper models and reserve expensive models for complex reasoning tasks. A routing layer that examines the input and selects the appropriate model can cut costs by 40–60% with minimal quality impact.
Caching. Cache LLM responses for identical or near-identical inputs. Semantic caching — embedding the input and checking for similar cached queries — can achieve 20–40% cache hit rates for customer support agents where many users ask similar questions.
15.9 Monitoring in Production
Agent monitoring requires metrics that traditional application monitoring does not track. You need four categories: infrastructure metrics (CPU, memory, error rates), LLM metrics (latency per call, tokens per request, model error rates), agent metrics (tool call frequency, chain length, fallback rate), and quality metrics (user feedback, task completion rate, hallucination rate from automated checks).
# src/monitoring.py — Structured logging and metrics for agent services
import structlog
import time
from prometheus_client import Counter, Histogram, Gauge

logger = structlog.get_logger()

# Prometheus metrics
LLM_REQUEST_DURATION = Histogram(
    "llm_request_duration_seconds",
    "Time spent on LLM API calls",
    labelnames=["model", "status"],
    buckets=[0.5, 1.0, 2.0, 5.0, 10.0, 30.0],
)

LLM_TOKENS_USED = Counter(
    "llm_tokens_total",
    "Total tokens consumed",
    labelnames=["model", "direction"],  # direction: input or output
)

AGENT_TOOL_CALLS = Counter(
    "agent_tool_calls_total",
    "Number of tool invocations by tool name",
    labelnames=["tool_name", "status"],
)

AGENT_CHAIN_LENGTH = Histogram(
    "agent_chain_length",
    "Number of LLM calls per user request",
    buckets=[1, 2, 3, 5, 8, 13, 20],
)

ACTIVE_SESSIONS = Gauge(
    "active_agent_sessions",
    "Currently active agent sessions",
)

FALLBACK_RATE = Counter(
    "agent_fallback_total",
    "Number of times fallback was triggered",
    labelnames=["fallback_type"],  # model_fallback, cache_fallback, static_fallback
)


class AgentMonitor:
    """Instrument agent execution with structured logs and metrics."""

    def __init__(self, request_id: str):
        self.request_id = request_id
        self.start_time = time.time()
        self.log = logger.bind(request_id=request_id)
        ACTIVE_SESSIONS.inc()

    def record_llm_call(self, model: str, duration: float,
                        input_tokens: int, output_tokens: int, status: str):
        LLM_REQUEST_DURATION.labels(model=model, status=status).observe(duration)
        LLM_TOKENS_USED.labels(model=model, direction="input").inc(input_tokens)
        LLM_TOKENS_USED.labels(model=model, direction="output").inc(output_tokens)
        self.log.info("llm_call", model=model, duration=round(duration, 3),
                      input_tokens=input_tokens, output_tokens=output_tokens,
                      status=status)

    def record_tool_call(self, tool_name: str, status: str, duration: float):
        AGENT_TOOL_CALLS.labels(tool_name=tool_name, status=status).inc()
        self.log.info("tool_call", tool=tool_name, status=status,
                      duration=round(duration, 3))

    def record_fallback(self, fallback_type: str):
        FALLBACK_RATE.labels(fallback_type=fallback_type).inc()
        self.log.warning("fallback_triggered", type=fallback_type)

    def finish(self, chain_length: int, status: str):
        duration = time.time() - self.start_time
        AGENT_CHAIN_LENGTH.observe(chain_length)
        ACTIVE_SESSIONS.dec()
        self.log.info("request_complete", duration=round(duration, 3),
                      chain_length=chain_length, status=status)
The metrics above feed into dashboards that answer three questions at a glance: Is the service healthy? (error rate, latency p50/p95/p99). Is it expensive? (token consumption rate, estimated daily cost). Is the agent behaving correctly? (chain length distribution, fallback rate, tool success rate). A spike in chain length often indicates a prompt regression: the agent is looping because it cannot determine when to stop. A rising fallback rate indicates a provider issue before users start complaining.
Production Consideration: Alerting Thresholds for Agent Services
Set alerts on: error rate above 5% for 5 minutes (page immediately), p95 latency above 15 seconds for 10 minutes (warning), fallback rate above 20% for 5 minutes (warning), daily cost exceeding 120% of forecast (warning), and chain length p95 above 10 (investigate prompt regression). These thresholds are starting points — adjust them based on your baseline after two weeks of production data.
15.10 Deployment Topology
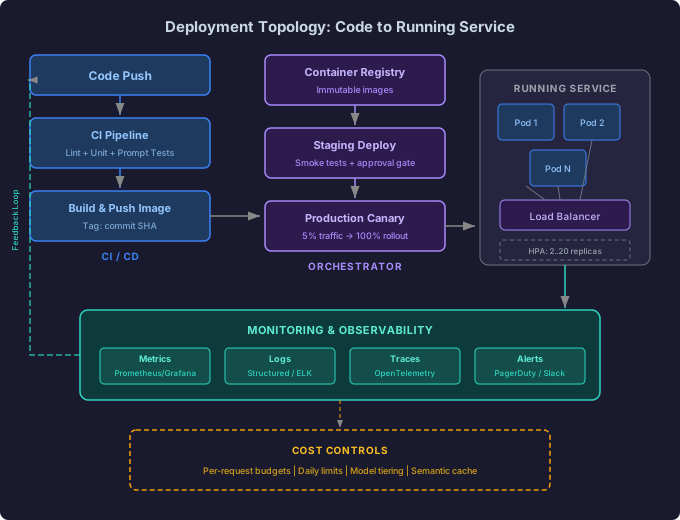
Figure 15-1. Deployment topology: from code commit through CI/CD, container orchestration, running services, and monitoring with cost controls. The feedback loop from monitoring back to CI/CD enables automated rollbacks and prompt regression detection.
When Agents Fail: Lessons from Production
The metrics, fallbacks, and cost controls described in this chapter exist because agent systems fail in production — not in theory, but in practice, with real money, real customers, and real consequences.
The Incident: TravelAssist's Escalation Catastrophe
TravelAssist (a pseudonym) deployed a customer service agent to handle booking modifications, cancellations, and refund requests for a mid-size online travel agency. The system processed roughly 8,000 conversations per day. The agent could look up bookings, check cancellation policies, calculate refund amounts, issue refunds up to $500 automatically, and escalate to a human agent for anything above that threshold.
In month three of production, the engineering team updated the cancellation policy tool to support a new "flexible booking" tier. The tool's response format changed: the field refund_eligible moved from the top-level JSON to a nested policy.eligibility.refund_eligible path. The agent's system prompt still referenced the old path.
When the agent called the cancellation policy tool and could not find refund_eligible at the top level, it did not error. Instead, it reasoned — incorrectly but plausibly — that the absence of the field meant the booking was non-refundable. For standard bookings, this happened to be correct roughly 60% of the time, masking the problem. For flexible bookings, the premium tier whose entire value proposition was easy cancellation, the agent told every customer their booking was non-refundable and offered a travel credit instead.
Customers who pushed back were escalated to human agents. But the escalation logic had a second flaw: it classified persistent customers as "adversarial" based on a sentiment analysis step that flagged repeated requests as negative sentiment. The escalation note sent to the human agent read: "Customer is disputing non-refundable cancellation policy. Sentiment: negative. Recommended action: hold firm on policy." Human agents, trusting the AI's policy lookup, upheld the incorrect decision in 73% of cases.
Over 11 days, 2,340 flexible-booking customers were incorrectly denied refunds. When the error was discovered — through a spike in social media complaints rather than through monitoring — TravelAssist had to issue retroactive refunds totaling $1.8 million, plus $200 goodwill credits per affected customer. The total cost exceeded $2.2 million. The company's app store rating dropped from 4.3 to 3.1 in two weeks.
Root Cause Analysis
The post-mortem identified five contributing factors, none of which alone would have caused the incident:
-
No schema validation on tool responses. The agent consumed tool outputs as unstructured text. When the JSON structure changed, there was no validation step that would have caught the missing field and raised an error.
-
No confidence threshold on policy decisions. The agent was never required to express confidence in its determination. A rule requiring the agent to flag any refund decision where the underlying data was ambiguous would have caught the missing-field problem immediately.
-
Missing fallback for data ambiguity. When the agent could not find the expected field, the correct behavior was to escalate to a human, not to infer meaning from the absence of data. The system had no "I am not sure" pathway for policy decisions.
-
Poisoned escalation context. The sentiment analysis step contaminated the human review process. Human agents received a biased summary that framed the customer as difficult rather than presenting the raw facts. The AI's confidence became the human's anchor.
-
No behavioral monitoring on refund approval rates. The refund approval rate for flexible bookings dropped from 94% to 31% overnight. This metric was not tracked per booking tier. The aggregate refund rate across all booking types shifted only modestly, staying within alert thresholds.
Architectural Lessons Learned
- Validate tool response schemas before the model sees them. Parse tool outputs against expected schemas. If a required field is missing or a type is wrong, route to an error handler. Never let the model interpret malformed data.
- Require explicit confidence signals for high-stakes decisions. Force the agent to output a confidence score alongside any decision that involves money, access control, or irreversible actions. Route low-confidence decisions to human review automatically.
- Design escalation as a first-class workflow, not a fallback. Escalation context should include raw data, the agent's reasoning chain, and the specific point of uncertainty. It should not be a summarized recommendation that anchors the human reviewer.
- Monitor behavioral metrics at the granularity that matters. Aggregate metrics hide segment-level regressions. Track approval rates, error rates, and resolution times per customer tier, per product category, per booking type. A metric that cannot detect a 60-percentage-point drop in a specific segment is useless for that segment.
- Treat tool interface changes as breaking deployments. Any change to a tool's response format should trigger the same CI/CD validation pipeline as a model change or prompt change. Version tool schemas and test agent behavior against both the old and new schema before deploying.
Red Flags: Warning Signs of Impending Agent Failure
| Warning Sign | What It Looks Like in Telemetry | What It Usually Means | Recommended Action |
|---|---|---|---|
| Step count creep | p50 agent loop count increases 20%+ over a week | The model is struggling to reach a decision; prompt or tool degradation | Review recent prompt or tool changes; check retrieval quality |
| Confidence clustering | Agent confidence scores cluster at extremes (>0.95 or <0.2) with nothing in between | The model is not calibrated; it is guessing confidently or hedging entirely | Recalibrate confidence prompts; add few-shot examples of moderate confidence |
| Escalation rate spike | Human escalation rate doubles within 48 hours | The agent is encountering inputs it cannot handle; possible tool failure or policy change | Audit recent tool changes; sample escalated conversations for patterns |
| Tool call pattern shift | A tool that was called in 10% of runs is now called in 50% — or vice versa | The model's planning strategy has changed, often due to a prompt or model update | Compare traces before and after the shift; check for model version changes |
| Token usage divergence | Input tokens stable but output tokens increase 3x+ | The model is producing verbose reasoning or repeating itself in loops | Check for reasoning loops; review output truncation and stop conditions |
| Silent error accumulation | Tool calls return successfully (200) but with empty or null result fields | An upstream service is returning empty responses instead of errors | Add validation on tool response content, not just status codes |
| Feedback score decline | User satisfaction drops gradually over 7-14 days | Behavioral drift from model updates, data staleness, or accumulated prompt debt | Run a quality audit on recent traces; compare against known-good baselines |
| Cost-per-resolution increase | Average cost per completed task increases without a corresponding quality improvement | The agent is using more LLM calls without better outcomes; possible regression | Investigate chain length increases; check if fallback models are being used |
Project: Deploy Pipeline
Build a complete deployment pipeline for an agentic service. Start with a Dockerfile and docker-compose setup for local development. Add a CI/CD workflow (GitHub Actions or equivalent) that runs unit tests, prompt regression tests, builds the container image, and deploys to a staging environment. Implement health check endpoints (liveness and readiness), structured logging with request-level cost tracking, and a fallback mechanism that switches to a cheaper model when the primary model is unavailable. Instrument the service with Prometheus metrics and create a Grafana dashboard that shows LLM latency, token usage, error rate, and fallback frequency.
Stretch goals: add autoscaling configuration based on a custom metric (active sessions), implement a circuit breaker for the LLM provider, and add a canary deployment step that routes 5% of traffic to the new version before full rollout.
DevOps Support Agent Tech / Software: Deploys a code review and CI debugging assistant
Clinical Triage Agent Healthcare: Deploys a symptom-assessment agent with strict uptime SLAs
Trading Signal Agent Finance: Deploys a market analysis agent with latency-sensitive scaling
Tutoring Agent Education: Deploys a student Q&A agent with cost caps per session
Customer Service Agent E-commerce: Deploys an order and returns agent with seasonal scaling
Document Review Agent Legal: Deploys a contract analysis agent with audit logging
Exercises
| Type | Exercise | Description |
|---|---|---|
| Conceptual | Canary vs. blue-green | Your team debates whether to use canary deployments (gradually shifting traffic from 5% to 100%) or blue-green deployments (switching all traffic at once between two identical environments) for your agent service. Analyze the trade-offs of each strategy specifically for agentic workloads. Consider: how does the non-deterministic nature of LLM outputs affect your ability to detect regressions during a canary rollout? When would blue-green be safer despite its higher infrastructure cost? |
| Coding | Semantic response cache | Implement a caching layer that embeds incoming user queries, searches for semantically similar cached queries (cosine similarity above 0.95), and returns the cached response if found. Track cache hit rate, average similarity score of hits, and estimated cost savings. Include a cache invalidation strategy that expires entries when the prompt template version changes or after a configurable TTL. |
| Design | Multi-region agent deployment | Design a deployment architecture for an agent service that must serve users across three geographic regions with sub-2-second p95 latency. Address: where do you place the LLM provider calls (regional proxies or centralized?), how do you replicate the vector store across regions, how do you handle conversation state for users who travel between regions, and how do you manage prompt template deployments that must be consistent across all regions simultaneously? Sketch the architecture and identify the consistency trade-offs. |
See also: For enterprise approaches to LLM cost optimization, inference infrastructure, and performance benchmarking at scale, see The AI-First Enterprise, Chapter 12: Cost and Performance.