Chapter 06 of 20
When to Use Graphs (and When Not To)
A decision framework for evaluating whether a graph database belongs in your architecture. Covers six diagnostic questions, five use cases where graphs shine, five where relational is better, hybrid architecture patterns, and a cost comparison of Neo4j Aura, Amazon Neptune, and self-hosted options.
Overview
Your manager just read an article about Neo4j. Before you migrate everything, read this chapter first.
01. The Hype Cycle Is Real
 Graph databases have been gaining momentum since 2020. The arrival of GraphRAG and knowledge-graph-powered AI in 2024-2025 pushed them further into the spotlight. Articles with titles like "Why Every Enterprise Needs a Knowledge Graph" and "Graph Databases Will Replace SQL" are making the rounds.
Most of those articles are written by vendors. They are not wrong about the capabilities of graph databases, but they are wrong about the universality. Graph databases solve specific problems extremely well. For those problems, they are genuinely transformative. For everything else, they are an expensive complication.
This chapter gives you a structured framework for deciding where graphs fit in your architecture. It also covers where they do not belong.
Think of it like this: Graph databases are like a pickup truck. If you need to haul lumber, tow a trailer, or navigate rough terrain, a pickup truck is exactly right. If you need to commute 40 miles on a highway, a sedan is better. If someone tells you that everyone needs a pickup truck, they are either selling pickup trucks or they only haul lumber.
02. The Six Diagnostic Questions
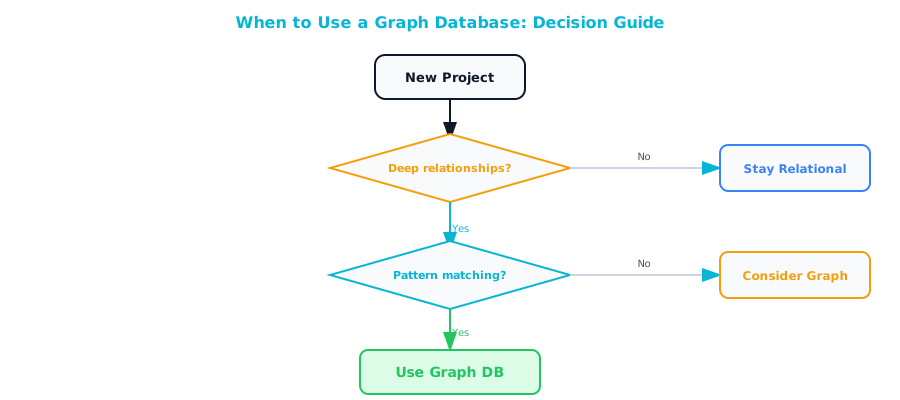
Before evaluating any specific graph product, answer these six questions about your workload. They are ordered from most important to least important.
Question 1: Does your data have deep, variable-length relationships?
What this means: Do you have queries that need to follow chains of connections where the depth is not known in advance? Org hierarchies with unknown depth. Supply chains with variable numbers of intermediaries. Dependency graphs where you need to trace impact to any level.
If yes: This is the strongest indicator for a graph database. Variable-length traversal is what graphs do best. It is what relational databases do worst.
If no: A fixed-depth relationship (manager → employee, one level) is handled perfectly well by a single JOIN. You probably do not need a graph.
Question 2: Do you need to traverse paths (not just query endpoints)?
What this means: Is the path itself important, or just the starting and ending points? "Find Bob's manager" queries the endpoint. "Show me the full approval chain for this purchase order" queries the path: every node along the way.
If yes: Path queries are graph territory. SQL can retrieve endpoints efficiently but struggles with full paths, especially when you need to return all intermediate nodes.
If no: Endpoint queries are well-served by relational JOINs. No graph needed.
Question 3: Is the relationship itself important (not just the entities)?
What this means: Do you care about attributes of the connections between entities? "Alice manages Bob" is a relationship. "Alice has managed Bob since 2022 with a performance rating of 4.5" is a relationship with properties. When the properties on the connection matter, you are dealing with rich relationships.
If yes: Property graphs handle relationship attributes natively. In SQL, this requires a junction table, which adds complexity to every query.
If no: Simple foreign-key relationships work fine in relational databases.
Question 4: Do your queries involve pattern matching across the network?
What this means: Are you looking for structural patterns in your data? "Find all triangles of companies that trade with each other." "Find all employees who report to someone in Department A but work on a project led by someone in Department B." These are pattern-matching queries.
If yes: Pattern matching is Cypher's core strength. Writing these queries in SQL requires multiple self-joins and is error-prone.
If no: Standard filtering and aggregation (WHERE, GROUP BY) works fine in SQL.
Question 5: Does the schema change frequently?
What this means: Are you regularly adding new entity types, new relationship types, or new properties? Graph databases are schema-optional. You can add new node labels, relationship types, and properties at any time without ALTER TABLE statements or migrations.
If yes: The schema flexibility of graphs is a significant advantage when your data model is evolving rapidly. This is common in early-stage products, research, and AI applications.
If no: A stable schema is a good thing. Relational databases enforce schema consistency and prevent data quality issues.
Question 6: Are you doing recommendations, fraud detection, or impact analysis?
What this means: These three use cases are the "killer apps" for graph databases. They are the workloads where the performance and expressiveness gap between graph and relational is largest.
If yes: A graph database should be your default choice for these workloads.
If no: That does not mean you do not need a graph. Go back to Questions 1-5.
03. The Scorecard
| Question | Your Answer |
|---|---|
| 1. Deep, variable-length relationships? | Yes / No |
| 2. Need to traverse paths, not just endpoints? | Yes / No |
| 3. Relationship properties matter? | Yes / No |
| 4. Pattern matching across the network? | Yes / No |
| 5. Schema changes frequently? | Yes / No |
| 6. Recommendations, fraud, or impact analysis? | Yes / No |
Scoring:
- 0-1 "Yes": A graph database is probably not worth the investment right now. Focus on optimizing your relational queries.
- 2-3 "Yes": A graph database is worth prototyping for the specific workloads where you answered "yes." Do not migrate everything. Add a graph alongside your relational database for the relationship-heavy use cases.
- 4-6 "Yes": A graph database should be a core component of your data architecture. The ROI will be significant in query performance, development speed, and the ability to answer questions that were previously impractical.
Think of it like this: This scorecard is like a doctor's checklist. One symptom might not mean anything. Two or three suggest something worth investigating. Four or more mean you should take action.
04. Five Use Cases Where Graphs Shine
Use Case 1: Fraud Detection
The problem: Fraudsters create networks of fake accounts that transact with each other to move money, inflate reviews, or manipulate systems. These networks are invisible when you look at individual transactions but obvious when you look at the connections between accounts.
Why graphs win: Fraud detection is fundamentally about finding patterns in networks: circular transactions, unusual clusters of connections, accounts that share devices or addresses with known bad actors. These patterns require multi-hop traversal and pattern matching, which are graph-native operations.
Real example:
// Find suspicious circular payment patterns
MATCH (a:Account)-[:SENT_TO]->(b:Account)-[:SENT_TO]->(c:Account)-[:SENT_TO]->(a)
WHERE a.created_date > date('2025-01-01')
  AND b.created_date > date('2025-01-01')
  AND c.created_date > date('2025-01-01')
RETURN a.id, b.id, c.id
SQL equivalent complexity: 20-40 lines with multiple self-joins. Often infeasible at scale because the query planner cannot optimize the circular join pattern.
Use Case 2: Supply Chain Dependency Mapping
The problem: Modern supply chains have multiple tiers of suppliers. When a disruption occurs (a factory closes, a port is blocked, a raw material becomes scarce), you need to know which of your products are affected. That includes indirect dependencies through sub-suppliers.
Why graphs win: Supply chains are inherently graph-structured. Supplier A provides components to Supplier B. Supplier B assembles them for Supplier C, who sells to you. Tracing this chain to identify vulnerabilities requires variable-depth traversal.
Real example:
// Find all products affected by a supplier disruption
MATCH (disrupted:Supplier {name: 'Acme Semiconductors'})
      <-[:SUPPLIES*1..5]-(sub:Supplier)
MATCH (sub)-[:SUPPLIES]->(part:Part)-[:USED_IN]->(product:Product)
RETURN DISTINCT product.name, product.revenue AS revenue_at_risk
ORDER BY revenue_at_risk DESC
Use Case 3: Recommendations
The problem: "Customers who bought X also bought Y" requires finding purchase patterns across the customer base. "People in similar roles with similar skills also took this training" requires matching across multiple dimensions.
Why graphs win: Recommendation engines rely on collaborative filtering. They find similar entities based on shared connections. This is a traversal problem: start at the user, find what they are connected to, find other users who share those connections, then find what those users are connected to that the original user is not.
Real example:
// Recommend training courses based on role and skill overlap
MATCH (me:Employee {id: $empId})-[:HAS_SKILL]->(skill)<-[:HAS_SKILL]-(peer)
WHERE peer <> me
MATCH (peer)-[:COMPLETED]->(course:Course)
WHERE NOT (me)-[:COMPLETED]->(course)
WITH course, COUNT(DISTINCT peer) AS peer_count
RETURN course.name, peer_count AS relevance
ORDER BY relevance DESC
LIMIT 5
Use Case 4: Compliance and Audit Trail
The problem: Regulatory compliance often requires tracing the full chain of actions, approvals, and entities involved in a decision. "Show me every person and system involved in approving this loan, their qualifications, and any conflicts of interest."
Why graphs win: Compliance queries span multiple entity types (people, documents, systems, decisions) and require following chains of relationships. The graph naturally models the paper trail that compliance teams need to trace.
Real example:
// Full audit trail for a loan approval
MATCH (loan:Loan {id: $loanId})<-[:APPROVED]-(approver:Employee)
MATCH (approver)-[:REPORTS_TO*0..5]->(senior:Employee)
MATCH (approver)-[:HAS_CERTIFICATION]->(cert:Certification)
OPTIONAL MATCH (approver)-[:HAS_RELATIONSHIP_WITH]->(borrower:Customer)
      <-[:APPLIED_FOR]-(loan)
RETURN approver.name, cert.name AS certification,
       collect(senior.name) AS management_chain,
       CASE WHEN borrower IS NOT NULL THEN 'CONFLICT' ELSE 'CLEAR' END AS conflict_status
Use Case 5: Knowledge Management for AI
The problem: Your organization's knowledge is scattered across documents, databases, wikis, and people's heads. Building an AI system that can answer questions about this knowledge requires more than finding relevant documents. It requires understanding how concepts, people, processes, and systems relate to each other.
Why graphs win: A knowledge graph structures your organization's information as a network of connected facts. When an AI agent needs to answer a complex question, it can traverse this network to find and assemble the answer.
Real example:
// AI agent querying knowledge graph:
// "What systems are affected if we change the authentication protocol?"
MATCH (auth:System {name: 'AuthService'})<-[:DEPENDS_ON*1..3]-(affected:System)
MATCH (affected)-[:OWNED_BY]->(team:Team)
MATCH (affected)-[:DOCUMENTED_IN]->(doc:Document)
RETURN affected.name, team.name AS owning_team, doc.url AS documentation
05. Five Use Cases Where Relational Is Still Better
Use Case 1: Standard CRUD Applications
User registration, profile management, content management systems, inventory tracking — these are tabular workloads with well-defined schemas and simple queries. A relational database is faster, simpler, and cheaper.
Use Case 2: Financial Reporting and Analytics
Revenue reports, budget tracking, quarterly summaries: these are aggregation-heavy workloads. SQL's GROUP BY, window functions, and ROLLUP are purpose-built for this. Graph databases can aggregate, but it is not their strength. The tooling (BI platforms, reporting frameworks) is built around SQL.
Use Case 3: Time-Series Data
IoT sensor readings, application logs, stock prices — data that arrives in chronological order and is queried by time range. Neither relational nor graph databases are optimal for this. Use a purpose-built time-series database (InfluxDB, TimescaleDB, Prometheus).
Use Case 4: Simple Transactional Systems
Point-of-sale systems, booking engines, order processing — workloads where the primary concern is ACID compliance, throughput, and consistency. Relational databases have 40 years of optimization for exactly this.
Use Case 5: Batch ETL and Data Warehousing
Moving large volumes of data between systems on a schedule. SQL-based ETL tools (dbt, Informatica, SSIS) dominate this space. Graph databases can participate as a target, but they are not the right orchestration layer for batch data movement. Use SQL-native tooling here.
Think of it like this: You would not use a sports car to move furniture, and you would not use a moving truck for a road trip. Relational databases are the moving trucks of data — excellent at carrying large loads reliably. Graph databases are the sports cars — excellent at navigating complex terrain quickly.
06. Hybrid Architectures: Graph + Relational Together
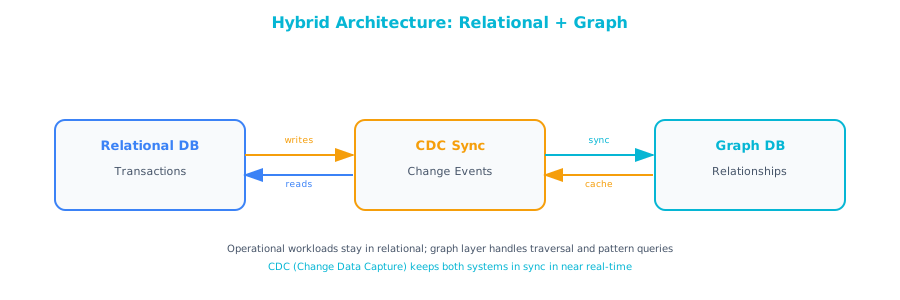
In practice, the most common architecture is hybrid. Your transactional data stays in PostgreSQL or MySQL. The relationship-heavy subset is replicated to a graph database. The two systems remain in sync.
Pattern
Graph as Read Replica
┌────────────────┐       ┌───────────────────┐
│  Application   │──────>│  PostgreSQL       │ (writes)
│                │       │  (transactional)  │
└────────┬───────┘       └─────────┬─────────┘
         │                         │ CDC / ETL
         │                         ▼
         │               ┌───────────────────┐
         └──────────────>│  Neo4j            │ (relationship reads)
                         │  (graph queries)  │
                         └───────────────────┘
The relational database is the system of record. The graph database is a read-optimized view of the relationship-heavy data. Changes flow from relational to graph via Change Data Capture (CDC) or scheduled ETL.
Best for: Adding graph capabilities to an existing application without modifying the write path.
Pattern
Polyglot Persistence
┌────────────────────────────────────┐
│            API Gateway             │
└──┬──────────┬──────────┬───────────┘
   │          │          │
   ▼          ▼          ▼
┌──────┐  ┌──────┐  ┌──────────┐
│ RDBMS│  │ Neo4j│  │ Vector DB│
│      │  │      │  │          │
│Users │  │Graph │  │ Docs     │
│Orders│  │Rels  │  │ Embeds   │
│Txns  │  │Know- │  │          │
│      │  │ledge │  │          │
└──────┘  └──────┘  └──────────┘
Each database handles what it does best. The application routes queries to the appropriate database based on query type.
Best for: Greenfield architectures or microservices where each service can choose its own data store.
Pattern
Graph as AI Layer
┌─────────────┐
│  AI Agent   │
└──────┬──────┘
       │
       ▼
┌──────────────┐     ┌──────────────┐
│  Knowledge   │────>│  Vector DB   │
│  Graph       │     │  (docs)      │
│  (Neo4j)     │     │              │
└──────┬───────┘     └──────────────┘
       │
       ▼
┌──────────────┐
│  PostgreSQL  │
│  (source of  │
│   truth)     │
└──────────────┘
The knowledge graph sits between the AI layer and the transactional databases. It is populated from the relational data and optimized for the AI agent's query patterns.
Best for: Adding AI capabilities to an existing enterprise application.
07. Cost Comparison
Cost is often the deciding factor. Here is a practical comparison as of early 2026.
Neo4j Aura (Cloud-Managed)
| Tier | Nodes/Rels | RAM | Price |
|---|---|---|---|
| Free | 200K nodes | 1 GB | $0 |
| Professional | Unlimited | 2-64 GB | ~$65-2,000/mo |
| Enterprise | Unlimited | 4-384 GB | Custom pricing |
Strengths: Fully managed, no ops overhead, good free tier for prototyping. Weaknesses: Can get expensive at scale, limited configuration options on lower tiers.
Amazon Neptune
| Configuration | Price (approx.) |
|---|---|
| Serverless (on-demand) | ~$0.10/hr base + I/O charges |
| Provisioned (db.r6g.large) | |
| Provisioned (db.r6g.4xlarge) | |
| Storage | $0.10/GB/month |
| I/O | $0.20 per million requests |
Strengths: Fully managed on AWS, integrates with IAM, CloudWatch, etc. Weaknesses: I/O charges can be unpredictable. Vendor lock-in. Less community support than Neo4j.
Self-Hosted (Neo4j Community or FalkorDB)
| Component | Price (approx.) |
|---|---|
| Neo4j Community Edition | Free (open source) |
| FalkorDB | Free (open source) |
| EC2 instance (m6i.xlarge) | ~$140/mo |
| EC2 instance (r6i.2xlarge) | ~$365/mo |
| EBS storage (500 GB gp3) | ~$40/mo |
| Ops overhead (your team's time) | 4-10 hrs/month |
Strengths: Full control, lowest per-unit cost, no vendor lock-in. Weaknesses: You own the uptime, backups, upgrades, and security patches.
Cost Decision Matrix
| Factor | Neo4j Aura | Neptune | Self-Hosted |
|---|---|---|---|
| Lowest entry cost | Free tier | ~$75/mo serverless | ~$180/mo |
| Best for prototyping | Yes | No | Maybe |
| Best for production (small) | Professional tier | Serverless | FalkorDB on small instance |
| Best for production (large) | Enterprise | Provisioned | Neo4j Enterprise (licensed) |
| Ops burden | None | Low (AWS managed) | High |
| Predictable billing | Yes | No (I/O charges vary) | Yes |
| Multi-cloud | Yes | No (AWS only) | Yes |
Think of it like this: Managed services (Aura, Neptune) are like renting an apartment — predictable costs, no maintenance, but limited control. Self-hosted is like owning a house — more control, potentially lower long-term cost, but you fix the plumbing yourself.
08. Building the Business Case
If you have scored 4 or more on the diagnostic questions and identified specific use cases, you need to build a business case. Here is a template.
The Problem Statement
"Our [compliance/fraud/recommendation/supply chain] queries currently [take X hours / cannot be answered / require manual research]. This affects [Y users / Z decisions / $W in revenue or risk]."
The Proposed Solution
"We will add a graph database alongside our existing relational database for [specific workload]. The graph will store [which subset of data]. Our existing transactional systems will not change."
The Cost
"Based on our data volume ([X] nodes, [Y] relationships), the estimated monthly cost is [$Z] for [Neo4j Aura / Neptune / self-hosted]. This includes [infrastructure + licensing + team training]."
The Expected Impact
| Metric | Current State | Expected with Graph |
|---|---|---|
| Query time for [specific query] | 4 hours | Under 5 seconds |
| Developer time for new relationship queries | 2-3 days | 2-3 hours |
| Questions users cannot currently ask | Many | Near zero |
| AI answer accuracy for relationship questions | Poor | High |
The Risk Mitigation
"We are NOT replacing our relational database. We are adding a specialized read layer for relationship queries. If the graph database does not perform as expected, our existing systems are unaffected. We will start with a single use case and expand only if the results justify it."
09. The Migration Checklist
If you have decided to proceed, here is the practical checklist for adding a graph database to your architecture.
Phase
Prototype (2-4 weeks)
- Identify one high-value use case from the diagnostic questions
- Sign up for Neo4j Aura free tier or run Neo4j locally via Docker
- Model the relevant data subset as a graph (use Chapter 4's patterns)
- Load sample data (1,000-10,000 entities)
- Write the key queries in Cypher (use Chapter 5's translations)
- Compare performance and readability against the SQL equivalents
- Demo to stakeholders
Phase
Pilot (4-8 weeks)
- Load production-scale data into the graph
- Set up data sync from relational to graph (CDC or scheduled ETL)
- Build the application integration (API layer or direct driver)
- Test with real users on the target use case
- Measure query performance, data freshness, and user satisfaction
- Document operational procedures (backup, monitoring, upgrade path)
Phase
Production (8-12 weeks)
- Harden the infrastructure (high availability, backups, monitoring)
- Train the operations team
- Roll out to full user base for the pilot use case
- Establish SLAs for graph database uptime and query performance
- Begin evaluating additional use cases for graph migration
Phase
Expansion (ongoing)
- Apply the diagnostic questions to other workloads
- Expand the graph model as new use cases are validated
- Consider AI integration (knowledge graph for RAG, agent tools)
- Evaluate whether the graph should become a system of record for relationship data (rather than a read replica)
10. The Bottom Line
Here is the honest assessment:
Graph databases are not a replacement for relational databases. They are a complement. The best architectures use both, routing each query to the database that handles it best.
Graph databases are transformative for a specific class of problems. If your data is deeply connected and your queries need to traverse those connections, a graph database will be faster, more expressive, and more maintainable than the relational equivalent.
The risk of doing nothing is real. If you have queries that take hours, questions that users have stopped asking, or AI systems that cannot answer relationship questions, you are paying a cost for not having a graph. That cost is harder to see. It shows up as missed opportunities, manual workarounds, and slow decision-making.
Start small, prove value, then expand. This is true for any technology adoption. It is especially true for graph databases because the learning curve is modest and the impact on the right use case is dramatic.
11. Chapter Checklist
Before moving to the next part of this book, make sure you can answer these questions:
- Can you score your current workload on the six diagnostic questions?
- Can you identify at least one use case in your organization where a graph would provide clear value?
- Can you articulate when relational is still the right choice?
- Do you understand the hybrid architecture patterns (read replica, polyglot, AI layer)?
- Can you estimate the monthly cost of a graph database for your workload?
- Could you write a one-page business case for adding a graph database?
If you answered yes to all six, you have the foundation to evaluate, pilot, and deploy a graph database alongside your existing systems. The rest of this book takes you deeper into implementation: building knowledge graphs, integrating with AI systems, and operating graph databases in production.