Chapter 02 of 17
Value Hypothesis & Portfolio Prioritization
A value hypothesis is not a requirement. It's a bet with stated odds — and how you write it determines whether you'll know when you're wrong.
Overview
Why a Hypothesis, Not a Requirement
Product requirements describe what to build. A value hypothesis describes why building it would matter — and under what conditions that belief would be proven wrong.
The distinction matters more for AI than for anything else a PM team builds. When you write a requirement, you're asserting that the problem is understood and the solution is known. When you write a hypothesis, you're acknowledging uncertainty and committing to a structured process for resolving it. In traditional software development, many features are understood well enough that the requirement framing holds. In AI feature development, almost nothing is understood well enough at the outset.
You don't know how accurate the model will be. You don't know whether users will trust its outputs. You don't know whether the feature will change behavior in the ways you expect, or whether the data you have is sufficient. Starting with a hypothesis isn't a sign of weakness — it's the correct epistemic posture for working with probabilistic systems.
The One-Sentence Value Hypothesis Template
Every AI feature should have a one-sentence value hypothesis. The template:
We believe that [user segment] will [behavioral outcome] because [AI capability] reduces/enables [specific friction or gap], which we will validate by [measurable signal] within [timeframe].
Each slot is doing specific work:
[user segment] — Not "users." A specific, describable group with a shared context. "Enterprise account managers who manage more than 50 accounts" is a user segment. "Our customers" is not.
[behavioral outcome] — Not an attitude change or a satisfaction score. An observable change in what users do. "Reduce time spent on weekly pipeline reviews by 30%" is behavioral. "Feel more confident about their pipeline" is not.
[AI capability] — What specifically the AI does that enables the outcome. "Surfaces accounts showing early-warning churn signals before the account manager notices manually" is specific. "Uses AI to provide insights" tells you nothing.
[specific friction or gap] — What the AI removes or enables that makes the behavioral outcome possible. This anchors the hypothesis in user reality rather than technical capability.
[measurable signal] — The leading indicator you'll track during validation. Not the ultimate business metric — a signal you can observe during an early experiment or limited release.
[timeframe] — Hypotheses without timeframes don't create accountability. Set one that's realistic for the validation approach you're planning.
5 Real-World Value Hypotheses
The difference between a hypothesis that creates useful direction and one that sounds reasonable but provides no guidance when data comes back ambiguous.
Example 1: AI-assisted meeting notes (strong)
We believe that mid-level managers who run 8 or more internal meetings per week will spend at least 50% less time on post-meeting documentation because our AI meeting summary feature reduces the effort of capturing and distributing action items, which we will validate by comparing documentation time logged in time-tracking tools for a 30-user cohort over six weeks.
The user segment is specific. The behavioral outcome is quantifiable. The AI capability is grounded in a real task. The friction is named. The validation signal is observable without self-reported sentiment.
Example 2: AI-assisted meeting notes (weak)
We believe users will find AI meeting summaries helpful because they save time on documentation.
"Users" is undefined. "Helpful" is not behavioral. "Save time" is unquantified. No validation signal, no timeframe. You could run a study and collect any outcome and interpret this as confirmed.
Example 3: Predictive churn scoring (strong)
We believe that customer success managers at accounts with 10+ users will initiate a proactive outreach within 5 days for at least 60% of accounts flagged as high-churn risk, because the AI prediction surfaces specific reasons alongside the risk score, reducing the time needed to formulate an outreach approach, which we will validate through CRM activity logs over one quarter.
This tests both the quality of the AI output (specific reasons, not just a score) and the behavior change, with a clear threshold to evaluate against.
Example 4: AI content generation (strong)
We believe that marketing coordinators at mid-market companies will publish at least 2x more social media content per month because the AI draft generator reduces first-draft time from 45 minutes to under 10 minutes, which we will validate by measuring post frequency for a cohort of 20 users during a 60-day beta.
The leverage ratio (45 min to 10 min) is specific and testable. The target (2x post frequency) is clear. The validation approach is concrete.
Example 5: AI-powered search (weak)
We believe adding AI to search will improve user satisfaction and help users find what they need more easily.
"Improve satisfaction" is not behavioral. "Find what they need more easily" is unquantifiable. No user segment, no AI capability description, no validation approach. This is a wish.
The pattern that separates strong from weak hypotheses isn't confidence — it's specificity. A strong hypothesis makes a claim you could be wrong about and tells you how you'd know.
The 4 Validation Dimensions
A value hypothesis isn't validated by a single experiment. It has four dimensions, each of which needs to clear before the feature moves to full development.
Dimension 1: Data Validation
The question: Does the data needed to power this AI feature exist, and is it accessible, sufficient in volume, and of adequate quality?
This dimension kills more otherwise-strong hypotheses than any other — and it kills them late, after the team has already invested significantly. Data validation should happen first, before feasibility, before adoption research.
What to assess: Does the data exist in your systems or can it be sourced? How complete is it? How labeled? Are there gaps, inconsistencies, or biases that would impair model performance? Is there enough volume to train or fine-tune, or to provide reliable retrieval context? Can you use this data for this purpose given your privacy policies and applicable regulations?
Red flags: data siloed across systems with no integration infrastructure. Data that theoretically exists but is locked in unstructured formats requiring significant preprocessing. Historical data that reflects workflows or behaviors that have since changed.
Dimension 2: Technical Feasibility
The question: Is the AI capability you're hypothesizing achievable at a quality level sufficient to produce the behavioral outcome you've described?
Work closely with ML engineering here — not to get certainty (it's not available at this stage) but to get an honest assessment of technical risk. The right framing: is this a well-explored problem or an open research question? What does best-in-class accuracy look like, and is that good enough for our use case?
What to assess: Does AI handle this task well in comparable contexts? What accuracy levels are realistic? What's the latency profile — can the AI respond within the time window the user experience requires? What's the infrastructure cost at target volume? Are there known failure modes or bias patterns to design around?
Red flags: tasks requiring reasoning that current models demonstrably struggle with. Latency requirements that current inference speeds can't meet. Cost per call that makes unit economics unworkable at scale.
Dimension 3: Adoption Feasibility
The question: Will target users actually use this feature, trust its outputs, and change their behavior in the ways the hypothesis describes?
Technically-oriented teams underweight this one consistently. A feature that works accurately still fails if users don't adopt it, don't trust it, or can't integrate it into their workflow. Those are three separate challenges.
What to assess: What is the user's current workflow, and where does the AI feature fit? How much behavior change does using the feature require? What's the user's baseline trust level for AI outputs in this type of task? Are there professional or cultural reasons users might resist AI involvement in this decision? Does the feature surface its outputs at the moment they'd be most actionable?
Red flags: features that require users to navigate to the AI output rather than surfacing it in context. Domains where users have strong professional identity tied to doing the task manually. Features where acting on a wrong AI recommendation is costly enough to create adoption-killing risk aversion.
Dimension 4: Economic Validation
The question: Is the value created by this feature worth the cost to build, maintain, and operate it?
AI features have different economics than traditional software in ways that matter here. Inference has a per-call cost that scales with usage. Quality maintenance requires ongoing investment that doesn't trail off after launch. Retraining or prompt tuning is a continuous operational cost, not a one-time development expense. The cost of quality failures — user trust erosion, support burden, potential liability — needs to be modeled explicitly, not assumed away.
What to assess: engineering and infrastructure cost to build and launch; ongoing operational cost per user or per call at target scale; maintenance cost including monitoring and quality improvement; the revenue or cost-savings the hypothesis claims; break-even timeline.
Red flags: unit economics that only work at scale you haven't reached. Cost structures driven primarily by third-party API pricing you don't control. ROI models that assume 100% adoption when your historical feature adoption rates are 30%.
Go/No-Go Gate Criteria
Each validation dimension should produce a gate decision, not just a finding.
| Dimension | Go | Conditional Go | No-Go |
|---|---|---|---|
| Data | Data exists, accessible, quality is sufficient | Data exists but requires 1–2 sprint investment to clean/access | Data doesn't exist or requires major new collection effort |
| Technical Feasibility | Prior art demonstrates achievable accuracy | Technically novel but similar problems have been solved | Open research question; no clear path to required accuracy |
| Adoption | Users express strong pain; workflow fit is natural | Users express pain; workflow integration requires some change management | Users unaware of pain; feature requires significant workflow disruption |
| Economics | Positive ROI within 2 quarters at current scale | Positive ROI at 2x current scale; achievable within 12 months | Unit economics only work at 10x+ current scale |
All four gates at "Go" — proceed to discovery. Any "No-Go" gate — pause pending a specific resolution plan. Multiple "Conditional Go" gates — build a prioritized research agenda before moving forward.
The AI Feature Value Canvas
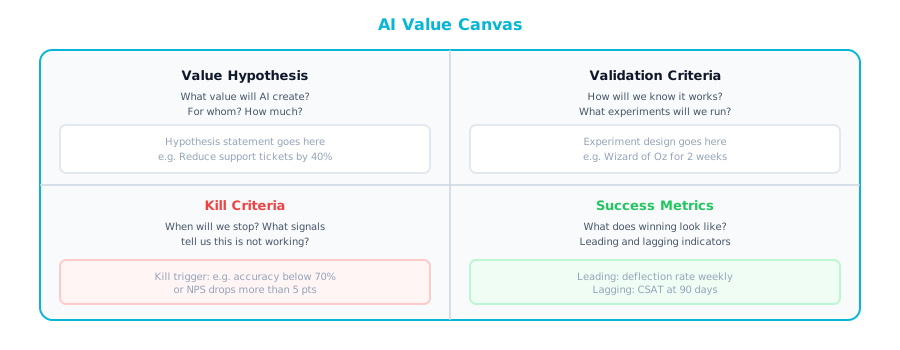
This one-page canvas consolidates your value hypothesis work into a format that can be shared, reviewed, and updated across the team. Treat it as a living document through early discovery — revisit and refine it as evidence comes in, not as a commitment that locks in assumptions.
AI Feature Value Canvas
Feature Name: Version / Date: PM Owner:
Value Hypothesis (one sentence): [Fill in using the template: We believe that... will... because... reduces/enables..., which we will validate by... within...]
User Segment: Who specifically? What context are they in? What do they do today?
Specific Pain or Gap: How does the user experience this today? What workaround do they use? How often?
AI Capability: What specifically does the AI do? Summarize, classify, predict, generate, detect?
Behavioral Change: What will users do differently? Be specific and measurable.
Validation Plan
| Dimension | Key Question | How We'll Validate | Timeline | Owner |
|---|---|---|---|---|
| Data | Does sufficient data exist? | |||
| Feasibility | Can the AI achieve required accuracy? | |||
| Adoption | Will users adopt and trust? | |||
| Economics | Does this pencil out? |
Assumptions (ranked by risk)
- Highest-risk assumption — if this is wrong, the whole hypothesis fails
Kill Criteria: Under what conditions would we stop this work? What would we need to see to conclude the hypothesis is wrong?
Current Gate Status:
- Data: Go / Conditional Go / No-Go
- Feasibility: Go / Conditional Go / No-Go
- Adoption: Go / Conditional Go / No-Go
- Economics: Go / Conditional Go / No-Go
The kill criteria field deserves special attention. Most teams fill in the positive validation signals clearly and leave kill criteria vague. Knowing when to stop is as important as knowing when to continue. If you can't articulate what would convince you the hypothesis is wrong, you haven't thought through the assumption structure.
Common Hypothesis Failure Modes
The metric mismatch: The behavioral outcome is measurable, but the validation metric doesn't actually measure it. "Users will adopt this faster" validated by login tracking — but logins don't distinguish between users who adopted the feature and users who logged in once to see what it was before ignoring it.
The user segment drift: The hypothesis is written for one segment, but the validation experiment recruits a different one. The feature appears to validate because this segment has the pain. The segment you actually need to sell to doesn't.
The survivorship bias trap: Validation is done with early adopters — the most motivated, most technically comfortable users — and results are extrapolated to the full user base. Early adopter behavior is not representative of mainstream adoption.
The demo effect: The feature is validated using curated demo data or handpicked examples, not a realistic sample of the messy, incomplete, edge-case-laden data it will encounter in production. The hypothesis validates; the launch disappoints.
The outcome attribution problem: The behavioral outcome you're measuring improves during validation, but the cause isn't the AI feature — it's a process change, a product release, or a seasonal effect that happened at the same time. Without a control group, you can't distinguish.
The Problem with 10 AI Ideas
Once you've written strong value hypotheses, you'll face a new problem: too many of them. Your organization has developed genuine enthusiasm for AI. Ideas are flowing from engineering, sales, the executive team, customer success. You have ten potentially interesting AI feature concepts and capacity to meaningfully pursue two of them in the next two quarters.
Which two?
This question is harder for AI features than for traditional product features for three reasons.
Uncertainty is structural, not incidental. In traditional product development, you can estimate effort with reasonable accuracy once discovery is done. In AI development, even after thorough discovery, you often don't know whether the approach will work at all. Two features that look equivalent on paper can require radically different timelines depending on data quality, model behavior, and edge case complexity. You often can't tell which is which until you're deep in the work.
The impact is harder to compare. An automation feature that saves your operations team 20 hours per week is valuable — but it's a different kind of value than a transformation feature that enables an entirely new product motion. Comparing them on a single impact score obscures the strategic difference.
The cost of a wrong bet is higher. An AI feature that doesn't work after three months has consumed engineering time, burned ML infrastructure costs, set stakeholder expectations, and potentially shipped a poor user experience that damages trust in AI features broadly — not just that one.
Adding the Uncertainty Dimension
The standard impact-vs-feasibility matrix is insufficient for AI. You need a third dimension: uncertainty — the probability that the approach you're planning will produce the quality outcome you're hypothesizing, given what you currently know.
Consider two features:
- Feature A: High impact, medium effort, low uncertainty (you've done this type of AI before, the data is clean, similar implementations exist at comparable companies)
- Feature B: High impact, medium effort, high uncertainty (the approach is novel, the data is messier than you'd like, you're not sure the accuracy you need is achievable)
A traditional matrix rates them equally. Feature B carries materially higher expected cost because a portion of that "medium effort" may be spent discovering the approach doesn't work at all. At that point you've consumed resources and have nothing to show.
The AI Prioritization Matrix
For each feature, score the following (1–5 scale):
Impact Score (1–5):
- 5: Changes a core user workflow; enables a capability that creates measurable revenue or cost impact; high strategic value
- 3: Meaningful improvement to an existing capability; positive but not transformative user outcome
- 1: Nice to have; limited user segment; marginal efficiency gain
Feasibility Score (1–5):
- 5: Straightforward implementation; data is clean and available; well-established AI approach; similar features exist
- 3: Some complexity; data requires preparation; moderate technical risk; similar but not identical problems have been solved
- 1: High complexity; data gaps; novel approach; no clear precedent for required accuracy level
Uncertainty Score (1–5): Score uncertainty high (4–5) when you're less certain — a high score here is a warning signal, not a positive.
- 5: Core assumption is unvalidated; approach is novel; significant data risk; no comparable prior art
- 3: Some validated signal; one or two open technical questions; data quality is mixed
- 1: Strong prior validation; approach is well-understood; data quality is high
Composite Priority Score = Impact × Feasibility ÷ Uncertainty
| Feature | Impact (1–5) | Feasibility (1–5) | Uncertainty (1–5) | Priority Score |
|---|---|---|---|---|
| Example A | 5 | 4 | 2 | 10.0 |
| Example B | 4 | 4 | 2 | 8.0 |
| Example C | 5 | 3 | 3 | 5.0 |
| Example D | 3 | 5 | 4 | 3.75 |
| Example E | 5 | 2 | 5 | 2.0 |
Feature E has the same impact as Feature A and is four times lower priority. That doesn't mean never build it — it means it needs a research spike to reduce uncertainty before it earns a committed roadmap slot.
Kill Discipline: Every Initiative Needs a Kill Date
The most common AI portfolio failure isn't picking the wrong features. It's failing to kill them when they stop making sense.
The result is the perpetual pilot: a feature that's always "almost ready," always one more sprint from working, always showing partial results that justify continued investment without ever reaching production quality. Perpetual pilots consume engineering resources, occupy ML infrastructure, distract the team, and — most insidiously — give leadership the impression the organization is working on AI without ever delivering user value.
Every AI initiative, from the day it enters the roadmap, should have a pre-committed date at which the team will explicitly evaluate whether to continue, pivot, or stop — and where stopping is a genuinely acceptable outcome.
The kill date is not a deadline to have the feature done. It's a decision point. You look at the evidence — model quality, user research, data availability, cost modeling — and make a Go/Pivot/Kill call.
Setting kill dates: Use the validation timeline from your value hypothesis as the starting point. If the hypothesis said you'd validate adoption in six weeks, six weeks is when you either have the evidence or you don't. If you've been trying to hit a required accuracy level for eight sprints and you're not converging, that's data — not bad luck.
Making killing culturally acceptable: Kill dates only work if killing is treated as disciplined capital allocation, not failure. If stopping an AI initiative is seen as failure, teams will always find a reason to continue. Leadership needs to communicate clearly that killing an initiative that failed to validate is a success of the process.
Portfolio Balance: Automation vs. Transformation Mix
A healthy AI portfolio isn't all high-certainty automation (too conservative) or all high-upside transformation (too risky). It requires a deliberate mix, calibrated to your AI maturity.
Early AI maturity (first 1–2 years): Target: ~70% automation, ~30% transformation. You need wins that build trust with users and internal stakeholders, prove the team can ship AI features that work, and generate the data and infrastructure that more ambitious features will require.
Developing AI maturity (some features in production): Target: ~50% automation, ~50% transformation. You've proven you can ship. Now you need to demonstrate that AI creates differentiated value, not just operational efficiency.
Advanced AI maturity (multiple features in production, ML infrastructure in place): Target: ~30% automation, ~70% transformation. Your competitive advantage is increasingly determined by doing things competitors can't, not by doing what everyone else does more efficiently.
These are starting ratios, not formulas. The principle is that you have deliberate portfolio balance — not an accidental distribution from whatever was easiest to approve in roadmap conversations.
Budget Allocation Framework
AI features have different cost structures than traditional software. Four categories every AI feature budget should address:
1. Exploration budget (time-boxed research) Data investigation, technical spike work, early prototyping, initial user research. Cap and time-box this — typically 2–4 sprints.
2. Development budget (build to launch) Model training or fine-tuning, evaluation dataset creation, integration work, and the UX that surfaces AI outputs to users. Estimate with explicit uncertainty buffers — 20–40% above your point estimate.
3. Quality budget (evaluation and hardening) Often underestimated and first to get cut when development runs over. Evaluation set development, human review of model outputs, edge case identification, bias auditing — the work between "technically working" and "safe to launch."
4. Operations budget (post-launch maintenance) Inference costs, monitoring, quality drift detection, retraining or prompt tuning, human review resources. This cost doesn't go away after launch.
| Phase | Allocation |
|---|---|
| Exploration | 10–15% |
| Development | 50–55% |
| Quality / Hardening | 15–20% |
| First-year operations | 15–20% |
Organizations that consistently underfund quality and operations ship features that don't sustain. The features launch. Then they quietly degrade.
Sequencing: Dependencies and Capability Building
Portfolio prioritization isn't just about which features are most valuable — it's about the order you build them. AI feature development creates infrastructure and capability that subsequent features depend on.
Data infrastructure: Features requiring similar data should be sequenced so the data engineering investment made for the first is reusable for subsequent ones.
Evaluation infrastructure: Every AI feature needs an evaluation framework. Building that framework from scratch for each feature compounds overhead unnecessarily.
Trust-building sequencing: Users' willingness to trust AI outputs is shaped by their prior experience with AI features in your product. High-confidence automation features before ambitious transformation features isn't just risk management — it's investment in the trust that future features will need.
A Working Example: Ten Ideas, Two Picks
You're the PM for an enterprise SaaS product with ten AI ideas:
- Auto-categorize support tickets (clear task, labeled data exists, similar solutions exist)
- Predict customer churn 30 days out (some signal, historical data exists, well-understood ML problem)
- Generate first-draft responses to support tickets (LLM, straightforward, data available)
- Surface relevant documentation when users encounter errors (retrieval, feasible, navigation data available)
- Auto-generate usage reports for account managers (structured data, LLM, medium complexity)
- Detect anomalous usage patterns that predict security issues (complex, limited labeled data, novel for your context)
- Personalize onboarding flow based on user role and behavior (medium complexity, some personalization data)
- Recommend feature adoption actions to CSMs based on account health (complex, requires good account health model first)
- Summarize customer health from multiple signals for exec review (structured data, well-understood task, LLM)
- Predict which free-trial users will convert (conversion data exists, classic ML problem)
Running these through the priority scoring framework:
| # | Impact | Feasibility | Uncertainty | Score |
|---|---|---|---|---|
| 1 | 3 | 5 | 1 | 15.0 |
| 4 | 4 | 4 | 2 | 8.0 |
| 9 | 4 | 4 | 2 | 8.0 |
| 10 | 4 | 4 | 2 | 8.0 |
| 3 | 3 | 4 | 2 | 6.0 |
| 2 | 5 | 3 | 3 | 5.0 |
| 5 | 3 | 3 | 2 | 4.5 |
| 7 | 3 | 3 | 3 | 3.0 |
| 8 | 4 | 2 | 4 | 2.0 |
| 6 | 4 | 2 | 5 | 1.6 |
Ticket auto-categorization (#1) is the clear first pick. The three-way tie at 8.0 needs a strategic tiebreaker: which one builds capability — data infrastructure, evaluation process, user trust — that the most subsequent features depend on? #10 (conversion prediction) builds a customer health foundation that #2 and #8 would later need. It earns the second slot.
Features #8 and #6 get nothing this cycle. #8 gets a defined exploration spike to reduce uncertainty. #6 gets parked until labeled data is available.
The goal isn't to build the most AI features. It's to build the right ones, at the right time, with enough discipline to stop the wrong ones before they consume everything.