Chapter 08 of 15
Measuring AI Success
Vanity metrics will make your AI program look good in a slide deck and fail in a budget review. Here is how to track the numbers that actually matter — and how to run a quarterly review that earns continued investment.
Overview
There is a classic trap in technology investment: the project team reports the system is working, the vendor confirms adoption is up, the dashboard looks green — and three quarters later, the CFO asks where the value is and nobody has a clean answer.
AI programs fall into this trap faster than almost any other technology investment, because AI is easy to deploy visibly and hard to evaluate honestly. You can show a chatbot answering questions. You can show a model generating reports. You can show usage statistics. None of that tells you whether the business is better off.
Why AI Metrics Are Harder Than They Look
 Measuring AI success is genuinely different from measuring most technology investments, for three reasons.
The baseline problem. When you buy a new ERP system, you can compare processing time before and after. AI often changes the nature of the task rather than just the speed of the old task. A document review process that used to take a lawyer 4 hours and now takes 30 minutes with AI assistance is a clean win. But what happens when the AI surfaces insights the lawyer would never have found manually? How do you measure value that did not exist before?
The attribution problem. AI rarely operates in isolation. It sits inside a workflow that includes human judgment, process changes, and other technology. When revenue increases 12% in a quarter where you also deployed an AI sales assistant, how much credit belongs to the AI? Attribution is genuinely difficult — anyone who claims otherwise is oversimplifying.
The time horizon problem. Some AI benefits are immediate (a chatbot deflects 40% of tier-1 support tickets starting day one). Others are slow-building (the AI system learns your product catalog over six months and gradually improves recommendation accuracy). Measuring both on the same quarterly cadence will make the slow-building investments look like failures even when they are not.
Understanding these three problems does not excuse poor measurement. It explains why your measurement system needs to be designed carefully rather than borrowed from a generic KPI framework.
The Fundamental Distinction: Vanity Metrics vs. Value Metrics
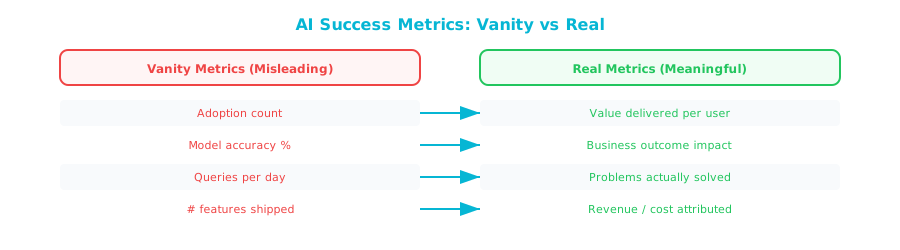
A vanity metric makes your program look active. A value metric tells you whether the program is making the business better.
Vanity metrics dominate early-stage AI reporting because they are easy to collect and look impressive. The number of API calls made. The number of documents processed. User satisfaction scores from the people who self-selected to use a new tool. These numbers are not lies — they are measuring the wrong thing.
Imagine hiring a new sales team and measuring their performance by counting the number of emails they send. They send 10,000 emails a month. That is a real number. It tells you almost nothing about whether your revenue is growing. AI metrics work the same way: activity is not outcomes.
The table below maps the most common vanity metrics to their corresponding real metrics and explains why the distinction matters.
Vanity vs. Real Metrics: The Master Table
| Vanity Metric | Real Metric | Why the Distinction Matters |
|---|---|---|
| Number of AI queries per day | Tasks completed without human escalation | Volume tells you usage; completion rate tells you whether the AI is actually capable |
| Chatbot satisfaction score (CSAT) | Ticket deflection rate and re-contact rate | Users may rate the bot highly and then call anyway — satisfaction without resolution is decoration |
| Model accuracy in testing | Error cost in production | A model can be 97% accurate and still cost more in errors than it saves, depending on the stakes of each decision |
| Documents processed per month | Analyst hours reallocated to higher-value work | Processing volume without downstream reallocation means nobody changed anything — the AI is just running alongside the old process |
| Number of employees using AI tools | Measurable productivity delta per employee | Adoption is not value; employees can use a tool and derive no benefit |
| AI suggestions accepted by users | Revenue or cost impact of accepted suggestions | Acceptance rate tells you the interface is pleasant; impact tells you whether the suggestions were good |
| Time to deploy a new AI feature | Time to measurable business outcome | Speed of deployment is an engineering metric; the business cares about speed to value |
| Number of use cases in production | Percentage of use cases meeting ROI targets | Having many use cases sounds impressive; having profitable ones is the actual goal |
| Vendor uptime / SLA compliance | Business continuity impact of outages | Uptime is a contract term; what matters is whether an outage at 2am on a Tuesday actually hurt anyone |
| Training completions | Behavioral change in how decisions are made | Completing an AI training module is not evidence that anyone is using AI differently |
| Cost per AI inference | Total cost of ownership vs. value delivered | A cheap model that produces bad outputs is not a bargain |
| Number of AI patents filed | Competitive differentiation with measurable revenue impact | Patents are an input; market advantage is the output |
Leading vs. Lagging Indicators
Every AI measurement program needs both types of indicators, and most programs only track one.
Lagging indicators tell you what happened. Revenue impact, cost reduction, error rate reduction — these are the outcomes that justify the investment. They are essential, but they arrive late. By the time a lagging indicator turns negative, you have often lost two or three quarters of corrective runway.
Leading indicators tell you what is about to happen. They are the early signals that a program is on track or in trouble, weeks or months before the lagging indicators confirm it.
In a manufacturing plant, "defects per million parts shipped" is a lagging indicator. By the time that number rises, you have already shipped bad product. "Machine calibration drift" and "operator error rate on setup checklists" are leading indicators — they tell you the defect rate is about to rise, while you still have time to intervene. Your AI program needs the same early warning system.
Common Leading Indicators for AI Programs
| Leading Indicator | What It Predicts | Threshold to Watch |
|---|---|---|
| Data freshness (days since last refresh) | Model accuracy degradation | >30 days for most operational models |
| User override rate (% of AI outputs users reject) | Model relevance drift; user trust erosion | Rising trend over 4+ weeks |
| Edge case escalation rate | Model encountering unfamiliar territory | >15% escalation rate on a mature deployment |
| Input distribution shift | Model about to encounter out-of-distribution data | Measured monthly; any significant shift warrants review |
| Human review queue depth | Downstream workflow bottleneck | Sustained growth suggests AI output quality is declining |
| Prompt abuse / misuse reports | Governance exposure | Any upward trend warrants immediate review |
| Vendor incident rate | Reliability risk building | More than 2 incidents per quarter warrants SLA renegotiation |
Common Lagging Indicators for AI Programs
| Lagging Indicator | Measurement Approach | Frequency |
|---|---|---|
| Direct cost reduction | Compare actual costs to pre-AI baseline, adjusted for volume | Quarterly |
| Revenue attributed to AI | Controlled test vs. holdout group where possible; otherwise trend correlation | Quarterly |
| Time-to-decision reduction | Sample-based audit of decision workflows | Semi-annually |
| Error/defect rate change | Pre/post comparison in quality control, compliance, or underwriting contexts | Quarterly |
| Customer satisfaction delta | NPS or CSAT change in AI-assisted vs. non-AI-assisted segments | Quarterly |
| Employee productivity | Output per FTE in AI-augmented roles vs. baseline | Semi-annually |
| Incident rate (AI-caused) | Audit log review + incident reports | Monthly |
Building Your Value Tracking System
A measurement system is only useful if it is owned, maintained, and acted upon. The following four elements are non-negotiable.
1. Assign a Measurement Owner
Every AI initiative needs a named person responsible for producing and defending the measurement data. This is not the vendor, not the data science team, and not the project manager. It is someone with enough business authority to gather data across functions and enough analytical integrity to report bad news without softening it.
In most organizations, this lands with a VP of Operations, a Finance Business Partner assigned to the initiative, or the Chief of Staff of the sponsoring executive. The important thing is that the measurement owner's incentives are aligned with truth, not with making the program look good.
2. Define Baseline Before Deployment
The single most common measurement failure is deploying AI, then trying to reconstruct what the baseline was. Define your baseline metrics before go-live:
- Current cost per unit (transaction, document, customer inquiry)
- Current cycle time for the target process
- Current error/defect rate
- Current headcount assigned to the target process
- Current customer satisfaction for the affected journey
If you do not have clean baseline data, invest four to eight weeks collecting it before you deploy. The alternative is arguing about the baseline for the life of the program.
3. Use Controlled Comparisons Where Possible
Not every AI deployment can support a controlled experiment, but many can. Running AI assistance for one sales region and not another for a quarter gives you cleaner attribution than a company-wide rollout. Assigning alternate customer inquiries to AI-assisted vs. human-only queues gives you real comparative data.
Controlled comparisons are resisted because they feel like slowing down deployment. They are actually the fastest way to prove value — and to terminate underperforming programs before they consume years of budget.
4. Report Honestly to Leadership
Build a reporting format that separates what you know from what you believe. A program reporting "we believe this initiative reduced churn" when what they have is a correlation with a confounded dataset is not being dishonest. But leadership needs to know the difference between confirmed value and estimated value.
A simple traffic-light system works well: green for confirmed, measured impact; yellow for estimated or modeled impact; red for insufficient data or negative result.
The Quarterly AI Review: A Template
Run this review every 90 days for every material AI initiative (anything above $250K in annual spend or with meaningful customer or employee impact).
Participants
- Initiative sponsor (VP or above)
- Measurement owner
- Technical lead (internal or vendor)
- Finance representative
- Risk/compliance representative (for regulated initiatives)
Agenda and Template
Section 1: Value Delivered (30 minutes)
Complete this table before the meeting and distribute in advance:
| Metric | Baseline | Last Quarter | This Quarter | Target | Status |
|---|---|---|---|---|---|
| [Primary value metric] | |||||
| [Secondary value metric] | |||||
| [Cost metric] | |||||
| [Quality metric] | |||||
| [User/customer metric] |
For each red or yellow row: one slide explaining root cause and corrective action.
Section 2: Health Indicators (15 minutes)
| Indicator | Current | Trend | Threshold | Action Required? |
|---|---|---|---|---|
| Data freshness | ||||
| User override rate | ||||
| Escalation rate | ||||
| Incident count | ||||
| Vendor SLA compliance |
Section 3: Forward Outlook (15 minutes)
- What is the projected value for the next quarter, and what assumptions does it rest on?
- What is the single biggest risk to that projection?
- What decision or resource is needed from leadership to achieve it?
Section 4: Continue / Modify / Escalate Decision (10 minutes)
Every quarterly review ends with an explicit decision:
- Continue as planned — metrics are on track, no material changes needed
- Modify — specific named changes to the approach, timeline, or resources
- Escalate — a problem requiring executive intervention that the team cannot resolve
- Recommend termination — see Chapter C4 on The Kill Decision
The Program-Level Dashboard
If you are running more than three AI initiatives, you need a portfolio-level view. The following one-page dashboard structure works at the board or executive committee level.
AI Portfolio Dashboard (Quarterly)
Portfolio Summary
| Q1 | Q2 | Q3 | Q4 | |
|---|---|---|---|---|
| Initiatives in production | ||||
| Initiatives meeting ROI target | ||||
| Initiatives on watch | ||||
| Initiatives recommended for review | ||||
| Total AI investment ($M) | ||||
| Confirmed value delivered ($M) | ||||
| ROI multiple (confirmed) |
Initiative Scorecard
| Initiative | Sponsor | Investment | Confirmed Value | Status | Next Review |
|---|---|---|---|---|---|
| [Name] | $XM | $XM | Green/Yellow/Red | [Date] |
Top Risks This Quarter
Decisions Required from Leadership
What Good Looks Like: Benchmarks by Initiative Type
These ranges are drawn from documented enterprise deployments. They are starting points for expectation-setting, not guarantees.
| Initiative Type | Typical Payback Period | Typical Year-2 ROI | Key Value Metric |
|---|---|---|---|
| Customer service automation (tier-1 deflection) | 6–12 months | 150–300% | Cost per resolved inquiry |
| Document review / contract analysis | 3–9 months | 200–400% | Attorney/analyst hours per document |
| Sales intelligence / lead scoring | 9–18 months | 80–200% | Pipeline conversion rate |
| Demand forecasting | 6–12 months | 100–250% | Forecast error reduction |
| Fraud detection | 3–6 months | 300–600% | Fraud loss per $1M processed |
| Predictive maintenance | 12–24 months | 150–300% | Unplanned downtime hours |
| HR / talent matching | 12–18 months | 80–150% | Time-to-hire; quality-of-hire |
| Regulatory compliance monitoring | 9–18 months | Hard to quantify; often risk-avoidance value | Findings per audit; fines avoided |
Note that "ROI" in this table reflects initiatives that are well-specified and properly governed. Poorly scoped initiatives in the same categories routinely deliver negative returns. The measurement system described in this chapter is part of what separates the two.
Somewhere between quarter two and quarter four of most AI programs, someone in finance will ask: "We have spent $X million on this. What have we gotten?"
The wrong answer is a slide deck full of usage statistics and satisfaction scores.
The right answer: "We committed to measuring three things. Here is what those three things show. Here is what we are confident in, here is what we are estimating, and here is where we do not yet have enough data. Based on that, here is our recommendation for the next phase."
That answer requires that you defined the three things before you started, measured them honestly throughout, and built the discipline of distinguishing confirmed value from estimated value. None of that is technically difficult. All of it requires deliberate choice.
The organizations that build this measurement discipline in their first two or three AI initiatives find that subsequent business cases get approved faster, governance friction drops, and the board stops treating AI investment as a leap of faith.